
Why are Column and Row Headings Important?
Column and row headings are essential elements in spreadsheets, serving as labels for data in each respective axis. These headings provide clarity, organization, and context to the data, making it easier to understand and analyze. Here are some reasons why column and row headings are important:
1. Improved Readability: By providing clear and concise labels, column and row headings enhance the readability of spreadsheets. They make it easier for users to locate specific data and understand the structure of the information presented. Without headings, the data can become confusing and difficult to interpret.
2. Enhanced Data Analysis: Column and row headings play a crucial role in data analysis. They allow users to identify and categorize different variables or data sets, enabling more efficient analysis and comparison. By organizing data into meaningful categories, headings enable users to uncover patterns, trends, and insights.
3. Easy Navigation: With proper column and row headings, users can easily navigate through large spreadsheets. Headings act as signposts, guiding users to the specific data they are looking for. This saves valuable time and effort, especially when working with complex datasets or performing calculations.
4. Consistency and Standardization: Column and row headings promote consistency and standardization in data presentation. When everyone follows a consistent naming convention, it becomes easier to collaborate and share information. Standardized headings also facilitate data import and export processes, as they ensure compatibility across different software and systems.
5. Error Prevention: Properly labeled column and row headings help prevent mistakes and reduce the risk of errors. When headings clearly define the content of each column or row, it becomes less likely for users to inadvertently input data in the wrong cell. This enhances data accuracy and reliability.
6. Documentation and Audit Trail: Column and row headings serve as documentation and an audit trail for the spreadsheet. They provide a record of the information presented and the variables used. This is particularly useful for reviewing and verifying data, as well as for future reference or troubleshooting purposes.
Overall, column and row headings are vital components of spreadsheets. They enhance readability, facilitate data analysis, promote consistency, reduce errors, and provide documentation. By incorporating well-structured headings in your spreadsheets, you can make your data more accessible and meaningful.
How to Create Column and Row Headings in Spreadsheets
Creating column and row headings in spreadsheets is a simple process that can greatly improve the organization and clarity of your data. Follow these steps to create effective headings:
1. Select the First Row and Column: In your spreadsheet, click on the first cell of the first row and column where you want to add the headings. This will be the starting point for your headings.
2. Enter the Heading Text: Type in the desired text for your column heading in the first row cell, and for your row heading in the first column cell. Keep the text clear, concise, and descriptive to accurately represent the data contained within each column or row. You can also format the text to make it stand out, such as by using bold or a larger font size.
3. Autofill the Headings: Once you have entered the first heading, you can easily autofill the remaining cells in the row or column. Hover the cursor over the bottom right corner of the cell until it turns into a small “+” symbol. Click and drag the cursor across the adjacent cells to autofill the headings for the entire row or column.
4. Freeze the Heading Row and Column: To ensure that your headings remain visible even when scrolling through a large dataset, it’s beneficial to freeze the heading row and column. Most spreadsheet software allows you to do this by selecting the cell just below the heading row, and the cell to the right of the heading column. Then, go to the “View” or “Window” tab and choose the “Freeze Panes” or “Freeze” option.
5. Format and Customize the Headings: To make your headings visually appealing and easier to differentiate, you can apply formatting options. This can include changing the font style, font color, background color, alignment, or adding borders. Experiment with different formatting choices to find a style that suits your preferences and enhances readability.
6. Modify and Update Headings: As your spreadsheet evolves or new data is added, you may need to modify or update your headings. To edit a heading, simply click on the cell containing the heading text and make the desired changes. The formatting options can also be adjusted if needed.
7. Use Filters or Sort Functions: Once your headings are in place, you can utilize the filtering and sorting functions of the spreadsheet software to manipulate and organize your data. These functions allow you to sort data based on column headings, filter specific criteria, and easily analyze subsets of information.
By following these steps, you can create column and row headings in your spreadsheets, making your data more organized and easier to understand. Effective headings contribute to efficient data analysis and enhance the overall usability of your spreadsheet.
Best Practices for Naming Column and Row Headings
Naming column and row headings in spreadsheets is crucial for maintaining consistency, clarity, and efficient data analysis. Here are some best practices to consider when naming your column and row headings:
1. Be Clear and Descriptive: Use clear and descriptive names for your column and row headings. Avoid using ambiguous or generic terms that may lead to confusion. Instead, choose names that accurately represent the data contained within the column or row.
2. Keep Headings Concise: While it’s important to be descriptive, it’s equally important to keep your headings concise. Long headings can make the spreadsheet cluttered and difficult to read. Aim for headings that are concise but still convey the necessary information.
3. Use Consistent Naming Conventions: Consistency is key when it comes to naming column and row headings. Decide on a naming convention at the beginning and stick to it throughout your spreadsheet. This makes it easier to locate and understand the data, especially when working with multiple sheets or complex datasets.
4. Order Headings Logically: Arrange your column headings and row headings in a logical order. For columns, consider using a hierarchical structure if applicable, starting with broader categories and moving towards more specific ones. For rows, arrange them in a way that makes logical sense and supports the analysis you plan to perform.
5. Avoid Special Characters and Spaces: It’s best to avoid using special characters or spaces in your headings, as they can cause issues when importing or exporting the data. Stick to alphanumeric characters, underscores, and hyphens to ensure compatibility across different software and systems.
6. Consider Data Validation: Data validation is a powerful feature in spreadsheets that helps maintain data integrity. Consider implementing data validation rules for your column and row headings to ensure that only valid data is entered in the respective cells.
7. Test and Review: Before finalizing your column and row headings, test them with actual data to ensure they make sense and accurately represent the data. Additionally, regularly review and update your headings as needed to accommodate any changes in the data or analysis requirements.
8. Seek Input from Team Members: If you are working in a collaborative environment, it can be beneficial to seek input from team members when naming column and row headings. This fosters a shared understanding and ensures that the headings are useful for everyone involved.
By following these best practices, you can create well-named column and row headings in your spreadsheets. These practices will not only improve the readability and organization of your data but also contribute to more effective data analysis and collaboration.
Common Mistakes to Avoid when Using Column and Row Headings
While column and row headings are vital for organizing and understanding the data in spreadsheets, there are some common mistakes that should be avoided. By recognizing and avoiding these mistakes, you can ensure that your headings are effective and contribute to accurate data analysis. Here are some common mistakes to watch out for:
1. Using Vague or Ambiguous Headings: One of the most common mistakes is using vague or ambiguous headings that do not clearly describe the data within the column or row. This leads to confusion and makes it challenging to interpret and analyze the data. Ensure that your headings are specific and descriptive to accurately represent the information they contain.
2. Overcomplicating Headings: While it is important to be descriptive, it is equally important to keep your headings concise. Overcomplicating headings with excessive words or unnecessary jargon can make the spreadsheet cluttered and difficult to read. Aim for simplicity and clarity when naming your headings.
3. Neglecting Consistency: Inconsistency in naming conventions can create confusion and hinder data analysis and collaboration. Ensure that your column and row headings follow a consistent naming convention throughout the spreadsheet. This promotes coherence, facilitates easier navigation, and ensures that everyone interpreting the data uses the same terminology.
4. Poor Organization and Ordering: Choosing an illogical or inconsistent order for your column and row headings can make it difficult to locate and understand the data. Organize your headings in a logical manner, whether that be alphabetically, numerically, or in a hierarchical structure that reflects the relationships between the headings.
5. Ignoring Data Validation: Failing to implement data validation rules for your headings can lead to inaccurate or irrelevant data being entered. Take advantage of data validation features in spreadsheets to enforce specific rules, such as minimum and maximum values or required formats, to ensure the integrity of the data associated with the headings.
6. Not Labeling Units or Measurements: Omitting the units or measurements associated with your column headings can lead to confusion and misinterpretation. Clearly label the units or measurements in the headings to provide context and ensure accurate understanding of the data.
7. Forgetting to Update Headings: As your spreadsheet evolves or new data is added, it is crucial to update your headings accordingly. Neglecting to do so can result in outdated or inaccurate representations of the data. Regularly review and update your column and row headings to reflect any changes in the dataset.
8. Lack of Testing and Review: Failing to test and review your column and row headings with actual data can lead to unforeseen issues. Before finalizing your headings, validate them by populating the spreadsheet with real data to ensure that they accurately represent the information and facilitate effective data analysis.
By avoiding these common mistakes, you can ensure that your column and row headings are clear, concise, and meaningful. Well-implemented headings contribute to accurate data analysis and enhance the usability of your spreadsheet.
Organizing and Formatting Column and Row Headings
Organizing and formatting column and row headings in spreadsheets is essential for improving the overall readability and usability of the data. By effectively organizing and formatting headings, you can enhance data interpretation and analysis. Here are some tips for organizing and formatting your column and row headings:
1. Group Related Headings: Grouping related column and row headings together helps create a visual hierarchy and improve the organization of the data. For example, if you have multiple columns representing different time periods, group them together to indicate their relationship and make it easier to locate and compare the data.
2. Use a Clear and Consistent Font Style: It is important to choose a font style that is clear and legible for your column and row headings. Avoid using fancy or complex fonts that may hinder readability. Additionally, use a consistent font style throughout the spreadsheet to maintain a cohesive appearance and avoid distracting inconsistencies.
3. Apply Bold or Formatting to Stand Out: To make your column and row headings more visually distinct, consider applying bold formatting or using a larger font size. This helps draw attention to the headings and distinguish them from the rest of the data. Be selective and use formatting sparingly to avoid overwhelming the reader.
4. Consider Adding Background Color: Another way to make your column and row headings stand out is by adding a background color. Choose a color that complements the overall style of your spreadsheet and enhances readability. However, be cautious not to use overly bright or contrasting colors that may strain the eye or compromise legibility.
5. Align Headings for Consistency: Align your column and row headings consistently to create a clean and professional appearance. Aligning headings to the left or center is often preferred, as it facilitates easy scanning and reading of the data. Avoid using right-aligned headings, as they can disrupt the natural flow of information.
6. Utilize Borders or Gridlines: Including borders or gridlines around your column and row headings can help visually separate them from the rest of the data. This creates a clear distinction and improves the overall organization of the spreadsheet. However, be mindful of not using excessive or distracting borders that may overshadow the actual data.
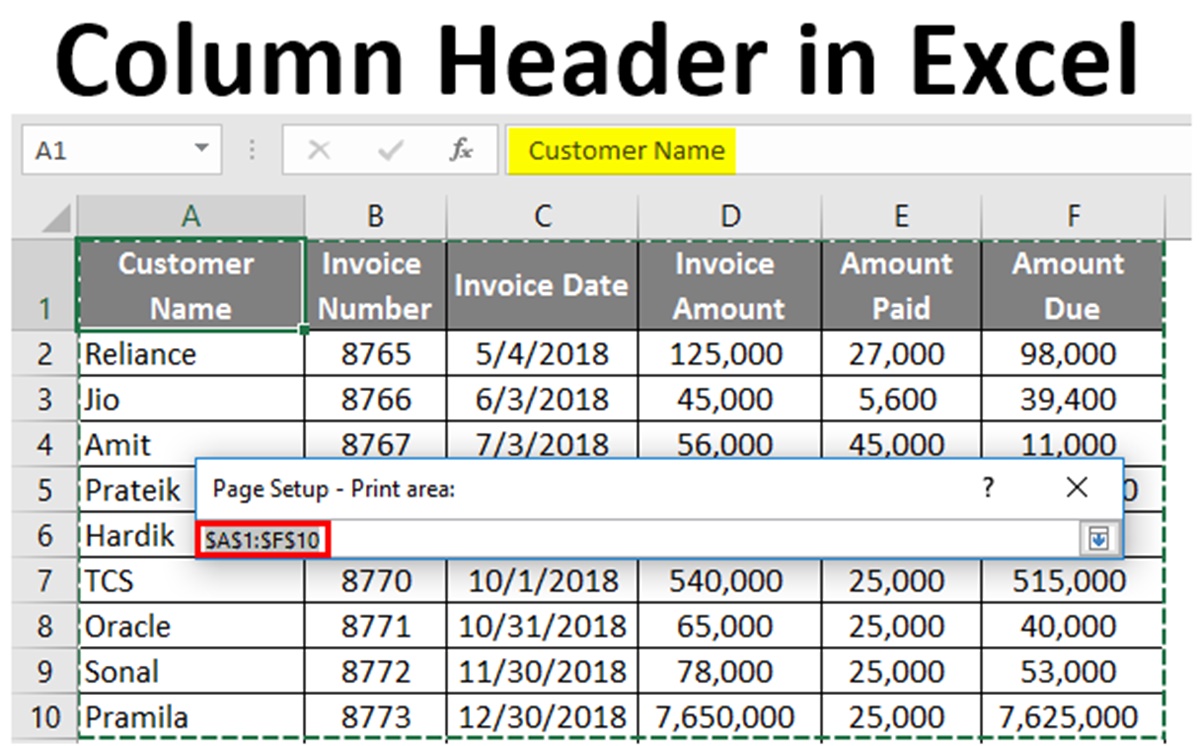
7. Keep Headings on Every Page: If your spreadsheet spans multiple pages when printed, ensure that the column and row headings remain visible on each page. This can be achieved by freezing the headings or using options like “Print Titles” in the page setup settings. Consistent headings across pages make it easier to understand and navigate the data.
8. Regularly Review and Adjust Formatting: As your spreadsheet evolves and your data changes, regularly review and adjust the formatting of your column and row headings. This includes checking for consistency, updating font styles or sizes, and reorganizing headings if needed. Keeping the formatting up to date ensures that the headings remain visually appealing and contribute to a cohesive presentation of the data.
By organizing and formatting your column and row headings effectively, you can improve the overall look and usability of your spreadsheet. Thoughtful organization and formatting help users quickly and accurately interpret the data and enhance the overall user experience.
The Role of Column and Row Headings in Data Analysis
Column and row headings play a critical role in data analysis, providing the necessary context and structure to facilitate understanding and interpretation. They serve as the foundation for organizing and categorizing data, allowing users to extract meaningful insights. Here are the key roles that column and row headings play in data analysis:
1. Data Identification: Column and row headings act as identifiers for the different variables and categories within a dataset. They provide a clear label for each column and row, making it easier to identify and locate specific data points. By associating descriptive headings with the data, users can quickly grasp the type of information represented in each column or row.
2. Data Organization: Headings are crucial for organizing data in a logical and structured manner. By categorizing data into columns with specific headings, users can compare and analyze information within distinct categories. Row headings, on the other hand, allow for the organization of data based on different dimensions or entities. This organization facilitates more efficient data analysis and helps users find patterns or trends.
3. Data Comparison and Analysis: Column and row headings enable users to compare data across different variables or dimensions. By aligning similar headings, users can easily track changes and variations, identify patterns, and analyze relationships between different data points. The headings provide a framework for comparing and contrasting data, supporting in-depth data analysis and interpretation.
4. Aggregation and Grouping: Headings allow users to aggregate and group data based on common criteria. By selecting and grouping data based on specific column or row headings, users can generate summaries or subsets of data. This aggregation helps in identifying trends, outliers, and anomalies, contributing to a deeper understanding of the dataset.
5. Filtering Data: With well-defined column and row headings, users can employ filtering techniques to focus on specific subsets of data. By filtering based on the values of certain headings, users can isolate and analyze specific data points or subsets. This helps in exploring data from various perspectives and extracting insights relevant to specific research questions or analysis goals.
6. Communication and Presentation: Column and row headings also assist in effectively communicating and presenting data analysis results to others. Clear and well-structured headings make it easier for readers or stakeholders to comprehend the data and the analysis performed. Whether in reports, presentations, or visualizations, headings provide context and help convey the key findings and insights derived from the data analysis.
Overall, column and row headings form the backbone of data analysis in spreadsheets. They provide structure, organization, and context to the data, enabling users to navigate, compare, and analyze information more effectively. By leveraging well-designed headings, analysts can uncover valuable insights and communicate their findings in a clear and meaningful way.
Advanced Techniques for Working with Column and Row Headings
While column and row headings serve as fundamental elements in spreadsheets, there are advanced techniques that can further enhance their effectiveness and maximize their utility in data analysis. These techniques enable users to work more efficiently with column and row headings, allowing for more in-depth analysis and interpretation of the data. Here are some advanced techniques for working with column and row headings:
1. Multi-Level Headings: Instead of using single-level headings, consider utilizing multi-level headings to provide more detailed categorization and organization of the data. This technique involves creating subheadings within main headings, allowing for a hierarchical structure. Multi-level headings enable users to drill down and analyze data at different levels of granularity, providing a more comprehensive view of the dataset.
2. Conditional Formatting: Apply conditional formatting to your column and row headings to dynamically highlight specific data based on certain conditions. This technique allows you to visually emphasize important information, outliers, or trends within the dataset. By setting up conditional formatting rules, you can automatically change the formatting of the headings based on the values or characteristics of the data.
3. Linking Headings to External Data Sources: In cases where your data is sourced from external databases or files, you can establish dynamic links between your column and row headings and the external data sources. By linking the headings to live data, any updates or changes in the external data source will automatically reflect in your spreadsheet. This technique ensures that your headings stay up to date and eliminate the need for manual data entry.
4. Using Data Validation: Implement data validation rules on your column and row headings to maintain data integrity and consistency. Data validation helps enforce specific criteria or constraints on the entered data, ensuring that it adheres to predefined rules. By applying data validation to the headings, you can prevent errors and maintain data quality throughout the spreadsheet.
5. Customizing Sorting and Filtering: When working with large datasets, consider customizing the sorting and filtering options for your column and row headings. This allows for more flexible and tailored data exploration. Customize the sorting criteria to align with the specific requirements of your analysis, and create advanced filters to narrow down the dataset based on different combinations of heading values.
6. Incorporating Formulas into Headings: Take advantage of the formula capabilities in spreadsheets by incorporating formulas into your column and row headings. This technique allows you to dynamically generate headings based on calculations or conditions. For example, you can use formulas to calculate averages, sums, or percentages and display the result in a heading. This can simplify data analysis by providing immediate insights into the summarized data.
7. Custom Views: Utilize custom views to create different perspectives of your spreadsheet, specifically focusing on different subsets of column and row headings. Custom views allow you to save and switch between various layout arrangements and configurations, making it easier to analyze specific aspects of the data without manually rearranging the headings each time.
By implementing these advanced techniques, you can optimize your use of column and row headings in spreadsheets. These techniques offer greater flexibility, automation, and customization, enabling you to perform more sophisticated and comprehensive data analysis.
Customizing Column and Row Headings in Spreadsheets
Customizing column and row headings in spreadsheets allows you to personalize the appearance and functionality of your data organization. By customizing headings, you can improve the readability, organization, and visual appeal of your spreadsheet. Here are some techniques for customizing column and row headings:
1. Font Styles and Formatting: Customize the font style, size, and formatting of your column and row headings to create a visually appealing and distinctive look. Experiment with different font options to find a style that is both easy to read and visually pleasing. Consider using bold or italic fonts to make your headings stand out.
2. Background Colors and Fill Effects: Apply background colors or fill effects to your column and row headings to visually differentiate them from the rest of the data. Choose colors that complement your spreadsheet theme and make sure they do not overpower the text or make it difficult to read. Using subtle shading or gradients can make your headings more visually appealing.
3. Borders and Gridlines: Add borders and gridlines around your column and row headings to create a clear separation between the headings and the data. Borders can also be utilized to highlight specific headings or create visual grouping. Experiment with different border styles and thicknesses to achieve the desired effect.
4. Merge Cells: Merge cells horizontally or vertically to combine multiple cells into a single larger cell. This can be useful when you have longer headings or when you want to emphasize a broader category. However, be cautious with merging cells as it can affect the functionality of sorting, filtering, or referencing formulas in your spreadsheet.
5. Use Symbols or Icons: Incorporate symbols or icons alongside your column and row headings to provide additional visual representation or meaning. For example, you can use arrows to indicate ascending or descending order, or use checkmarks and exclamation marks to highlight important information. Ensure that the symbols you use are relevant and easily understood by users.
6. Data Validation Lists: Implement data validation lists on your column and row headings to provide predefined options for data entry. This ensures consistency and accuracy when entering values associated with the headings. Data validation lists also make it easier for users to select the appropriate value from a dropdown menu rather than manually entering it.
7. Anchoring and Freeze Panes: Anchor or freeze the row or column containing your headings to keep them visible while scrolling through your data. This feature ensures that the headings are always accessible, providing context and reference as you navigate through different parts of your spreadsheet. Anchoring or freezing panes is especially beneficial in large datasets.
8. Hyperlinks: Add hyperlinks to your column and row headings to facilitate navigation to related content or other sections of your spreadsheet. This is particularly useful when you have a complex or lengthy spreadsheet with various interconnected sections. By clicking on the hyperlink in a heading, users can quickly jump to the corresponding location.
By customizing column and row headings in spreadsheets, you can improve the visual appeal, organization, and functionality of your data. Experiment with various customization options to find a style that aligns with your preferences and helps convey information more effectively.
Troubleshooting Common Issues with Column and Row Headings
While column and row headings are essential for organizing and analyzing data in spreadsheets, they can sometimes present challenges or encounter issues. By understanding and troubleshooting these common issues, you can ensure the effective use of column and row headings in your spreadsheet. Here are some common issues and troubleshooting tips:
1. Mismatched Headings: One common issue is having mismatched or inconsistent headings between different sheets or sections within the same spreadsheet. To address this, carefully review and compare the headings across sheets, ensuring they align and contain the same information. Make necessary adjustments to ensure consistency, avoiding confusion and data discrepancies.
2. Heading Alignment: Improper alignment of column and row headings can make it challenging to visually associate the headings with the relevant data. To resolve this issue, ensure that the headings are aligned correctly with their respective columns and rows. Use the alignment features provided in your spreadsheet software to align the headings to the left, center, or right as needed.
3. Cells Not Resizing Properly: Sometimes, column and row headings may not resize automatically or accurately along with the data when resizing cells or rows. To address this issue, manually adjust the column or row widths to ensure that the headings are visible and properly aligned with the data. Additionally, check if there are any frozen panes that may be affecting the resizing.
4. Missing or Incorrect Headings: Missing or incorrect headings can occur when data is imported from external sources or when copying and pasting data from other spreadsheets. To mitigate this issue, double-check the imported or copied data, ensuring that the correct headings are included. If necessary, manually add or correct the headings to accurately represent the data.
5. Overlapping or Cluttered Headings: Headings that overlap or appear cluttered can hinder the readability and interpretation of the data. To address this issue, adjust the column widths or row heights to provide enough space for the headings. Consider reducing font sizes or using abbreviations if space is limited. Alternatively, consider wrapping the text within headings to prevent overlapping.
6. Data Sorting Issues: Sorting data within spreadsheet columns can sometimes disrupt the alignment between the headings and the corresponding data rows. To avoid this issue, always select the entire range of data, including the column headings, when sorting. This ensures that the headings stay aligned with their respective data rows after the sorting process.
7. Inconsistent Formatting: Inconsistent formatting of column and row headings can lead to visual inconsistencies and make the spreadsheet appear unprofessional. To resolve this, review and standardize the formatting of your headings, such as font style, size, and background colors. Applying consistent formatting throughout the spreadsheet ensures a cohesive and visually appealing presentation.
8. Issues with Freezing Panes: Freezing panes, while useful for keeping headings visible when scrolling through data, can sometimes cause unintended issues. If you encounter problems with frozen panes, review the freeze settings and adjust them as needed. Ensure that the correct rows and columns are frozen and that the frozen panes do not interfere with the visibility or functionality of the headings.
By understanding and troubleshooting these common issues, you can ensure that your column and row headings in spreadsheets are accurate, consistent, and visually clear. Being aware of these issues and implementing the necessary fixes will help optimize the usability and effectiveness of your spreadsheet.