
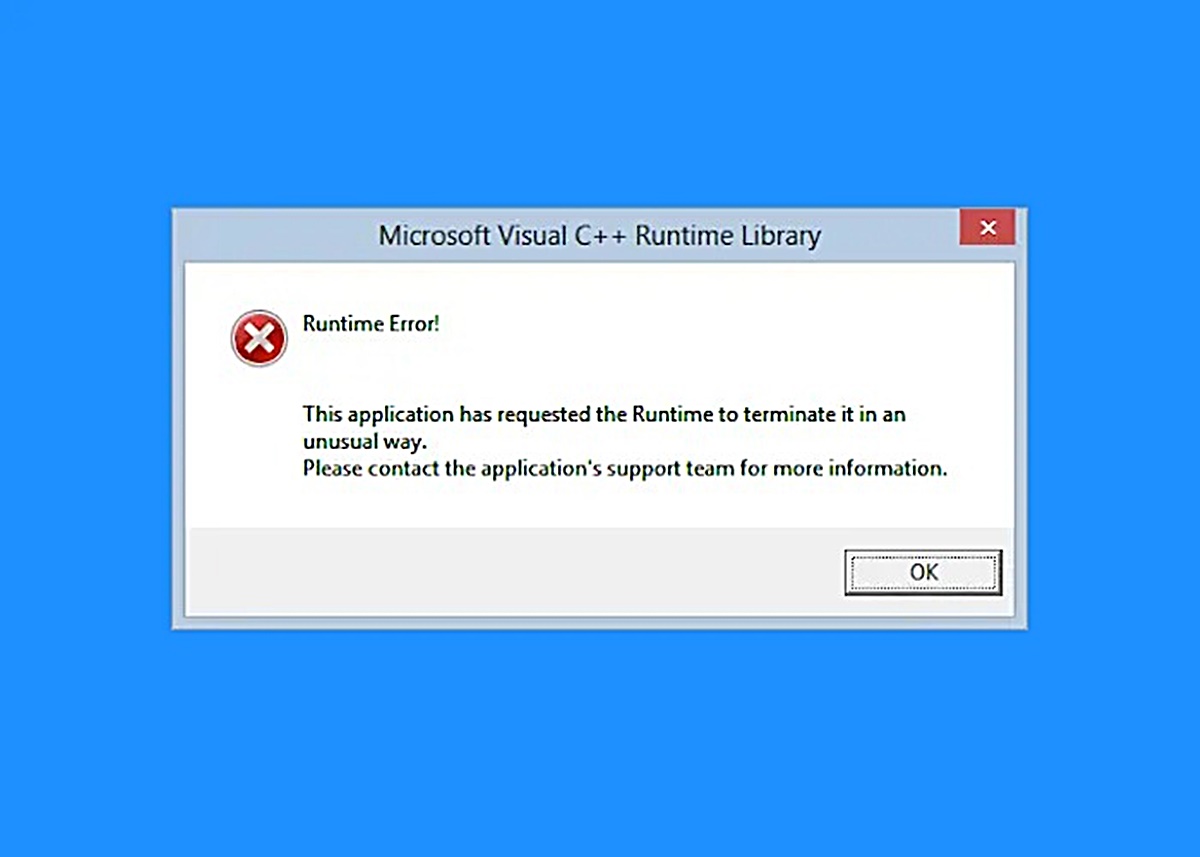
Understanding Runtime Errors
A runtime error is a type of error that occurs while a program is running. It happens when there is an unexpected behavior or exception that causes the program to terminate abruptly. Runtime errors can be frustrating for both developers and users, as they can hinder the proper functioning of the software. Understanding the nature of runtime errors is crucial for effective troubleshooting and fixing the issues.
There are several reasons why runtime errors may occur. One common type is a syntax error, which happens when the code violates the rules of the programming language. This could be a missing semicolon, a parenthesis mismatch, or misspelled commands. Syntax errors can be detected by the compiler and are usually straightforward to fix.
Another type of runtime error is a logic error. This occurs when the program runs without any syntax issues but produces incorrect or unexpected results. Logic errors are more difficult to identify and fix since they require a closer examination of the code’s algorithm and logic. They can result from incorrect calculations, faulty conditions, or incorrect usage of variables or functions.
Null pointer exceptions are a common type of runtime error. They occur when a program tries to access a reference that has not been initialized or points to a null value. These errors can be particularly tricky to debug, as they often result from erroneous memory management.
Memory errors, such as memory leaks or invalid memory accesses, can also lead to runtime errors. These errors occur when a program fails to allocate or deallocate memory correctly, leading to unexpected behavior or crashes. Fixing memory errors often requires careful review of the code and proper memory management techniques.
Stack overflow errors are another common type of runtime error. They occur when a program’s call stack, which stores function calls and local variables, exceeds its allocated memory. This can happen when there is a recursive function call without a proper base case, causing an infinite loop of function calls.
To effectively troubleshoot and fix runtime errors, developers can employ various debugging techniques. Utilizing a debugger tool can help identify the root cause of the error by stepping through the code and examining variables and their values. Reading error messages and reviewing logs and stack traces can provide valuable insights into the runtime error’s origin. Writing test cases and conducting thorough testing can help detect and prevent runtime errors before the software is deployed.
Exception handling is an essential practice in managing runtime errors. By properly handling exceptions, developers can gracefully handle errors and prevent program termination. Implementing try-catch blocks and robust error handling mechanisms can improve the stability and maintainability of the software.
In summary, understanding runtime errors is vital for efficient troubleshooting and fixing of issues in software. By identifying the type and cause of the error, developers can employ appropriate debugging techniques and implement best practices to prevent and resolve runtime errors effectively.
Common Types of Runtime Errors
Runtime errors can manifest in various forms, each with its own specific characteristics and implications. Understanding the common types of runtime errors can help developers better diagnose and address issues in their code. Let’s explore some of the most prevalent types of runtime errors:
- Null Pointer Exceptions: This type of runtime error occurs when a program attempts to access an object or variable that is null or has not been initialized. It often results from incorrect memory management or failure to check for null values before accessing them. Proper null checks and error handling can help prevent null pointer exceptions.
- Syntax Errors: Syntax errors occur when the code violates the rules and syntax of the programming language. They are typically caught by the compiler during the compilation phase. Examples of syntax errors include missing semicolons, mismatched parentheses, or misspelled keywords. Resolving syntax errors usually involves carefully reviewing the code and correcting the syntax issues.
- Logic Errors: Logic errors occur when the code runs without any syntactical problems but produces incorrect or unexpected results. These errors can arise from faulty calculations, incorrect use of conditional statements, or flawed algorithms. Diagnosing and fixing logic errors often involves carefully tracing the flow of the program and identifying faulty logic or incorrect variable usage.
- Memory Errors: Memory errors occur when a program fails to allocate or deallocate memory correctly. These errors can lead to memory leaks or invalid memory accesses, resulting in crashes or unpredictable behavior. Common memory errors include accessing freed memory, failing to release allocated memory, or attempting to write to read-only memory. Utilizing proper memory management practices, such as allocating and deallocating memory correctly, can help prevent memory errors.
- Stack Overflow Errors: Stack overflow errors occur when the program’s call stack exceeds its allocated size. This usually happens when a recursive function fails to have a proper base case, causing an infinite loop of function calls. Stack overflow errors can lead to program crashes or unexpected termination. Fixing this type of error involves re-evaluating the recursive function and ensuring it has a valid termination condition.
Understanding these common types of runtime errors provides a foundation for effective debugging and troubleshooting. By identifying the specific type of error, developers can employ targeted strategies to resolve the issue. It is important to adopt good programming practices, such as proper null checks, error handling, and memory management, to minimize the occurrence of runtime errors in software development.
Troubleshooting a Runtime Error
When encountering a runtime error, developers need to employ effective troubleshooting techniques to identify the cause of the error and resolve it. By following a structured approach, troubleshooting becomes more systematic and successful. Let’s explore some steps to troubleshoot a runtime error:
- Check for Syntax Errors: Start by reviewing the code for any syntax errors. Look for missing semicolons, mismatched parentheses, or misspelled keywords. A syntax error can cause the program to terminate abruptly. Correcting syntax errors can often resolve runtime errors.
- Analyze Logic Errors: If there are no syntax issues, the error may be due to a logic error. Debug the code by employing techniques such as adding print statements or using a debugger tool to track the flow and values of variables. Carefully review the algorithm and logic of the code to identify any incorrect calculations or faulty conditions.
- Handle Null Pointer Exceptions: If the runtime error is a null pointer exception, determine where the null value is being accessed. Use proper null checks and implement error handling mechanisms to prevent the program from crashing. Verify that objects and variables are properly initialized before they are accessed.
- Fix Memory Errors: Memory errors can be more challenging to troubleshoot. Carefully examine the code to check for memory leaks, improper memory accesses, or incorrect memory allocation/deallocation. Utilize tools like memory profilers to identify memory-related issues and ensure proper memory management practices are followed.
- Resolve Stack Overflow Errors: If the runtime error is a stack overflow error, review the recursive function that is causing the issue. Ensure that there is a proper base case to terminate the recursion. If needed, modify the code to limit the number of recursive calls or optimize the algorithm to minimize stack memory usage.
In addition to these steps, there are a few general troubleshooting techniques that can be helpful:
- Utilize a Debugger Tool: Debuggers allow for stepping through the code, examining variables and their values at runtime, and identifying the exact line where the error occurs. This can provide valuable insights into the cause of the runtime error.
- Read Error Messages: Pay close attention to error messages provided by the runtime environment. They often provide information about the nature and location of the error, assisting in narrowing down the issue.
- Review Logs and Stack Traces: Logs and stack traces can provide a trail of information about the program’s execution. Analyzing them can help identify the sequence of events leading up to the runtime error.
- Write Test Cases: Writing test cases can help pinpoint the specific scenarios in which the runtime error occurs. By reproducing the error in a controlled environment, it becomes easier to understand and fix the underlying issue.
By following these troubleshooting steps and techniques, developers can diagnose and fix runtime errors more effectively. The key is to methodically analyze the code, identify the specific type of error, and apply targeted solutions to resolve the issue.
Checking for Syntax Errors
Syntax errors are a common type of runtime error that can occur when the code violates the rules and syntax of the programming language. These errors are typically caught by the compiler during the compilation phase, but they can also lead to runtime issues if not addressed. To check for syntax errors, developers should follow these steps:
- Review the Code: Carefully examine the code, line by line, to identify any potential syntax issues. Look for missing semicolons, mismatched parentheses, or misspelled keywords. Pay attention to the structure and formatting of the code to ensure it conforms to the language’s syntax rules.
- Utilize an Integrated Development Environment (IDE): IDEs often have built-in syntax checking tools that highlight potential errors in real-time as you write the code. Take advantage of these features to catch syntax errors as you code. The IDE will typically underline or mark the problematic lines, making it easier to spot and correct mistakes.
- Compile the Code: If using a compiled language, make sure to compile the code after making any changes. The compiler will detect syntax errors and provide error messages indicating the problematic lines. Take note of these error messages as they often contain helpful hints about the cause of the syntax error.
- Pay Attention to Compiler Warnings: Even if the code compiles without errors, it is essential to review any compiler warnings. These warnings indicate potential issues that could lead to runtime errors. Investigate and resolve all warnings to ensure the code is free of syntax issues.
- Exercise Code Review Practices: Engage colleagues or members of the developer community to conduct code reviews. Fresh eyes can often spot syntax errors that were missed during initial development. Peer code reviews also offer an opportunity to learn best practices and gain insights from experienced developers.
When encountering syntax errors, it is crucial to fix them promptly as they can prevent the code from running correctly. Syntax errors can cause the program to terminate abruptly or produce unexpected results. By fixing syntax errors, developers can ensure their code follows the language’s syntax rules and eliminate potential sources of runtime errors.
Analyzing Logic Errors
Logic errors are a common type of runtime error that occurs when the code runs without any syntactical problems, but produces incorrect or unexpected results. Analyzing and fixing logic errors can be more challenging than syntax errors, as they often involve examining the algorithm and logic of the code. Here are some steps to help analyze and address logic errors:
- Examine Inputs and Outputs: Start by carefully reviewing the expected inputs and desired outputs of the code. Ensure that the inputs being provided are correct and properly formatted. Compare the actual outputs of the code with the expected outputs to identify any discrepancies.
- Isolate the Problem Area: Narrow down the section of the code where the logic error is occurring. This can be done using print statements or debuggers to trace the flow of the program execution. By isolating the problem area, it becomes easier to analyze the logic and identify the cause of the error.
- Review the Algorithm: Analyze the algorithm and logic of the code in the problem area. Ensure that calculations, conditions, and loops are implemented correctly. Pay attention to the order of operations, variable assignments, and conditional logic to pinpoint any potential mistakes.
- Use Defensive Programming: Implement defensive programming techniques by adding assertions and error checks throughout the code. These checks can help identify and catch logic errors early by verifying the correctness of assumptions and catching unexpected conditions or values.
- Debugging Tools: Utilize debugging tools and techniques to step through the code and examine the values of variables at runtime. Debuggers allow for systematic tracing of the code execution, making it easier to identify any logical inconsistencies or erroneous behavior.
It’s important to note that logic errors can be challenging to diagnose, especially in complex programs. Patience and a methodical approach are critical. It may also be helpful to seek input from colleagues or engage in pair programming to get fresh perspectives and potentially uncover logic errors that were missed during solo analysis.
Furthermore, writing comprehensive test cases can aid in identifying and addressing logic errors. By creating various test scenarios that cover different inputs and expected outputs, developers can more effectively trace and troubleshoot the logic behind the code’s behavior.
Remember to use logical thinking and attention to detail when analyzing logic errors. By thoroughly examining the algorithm and employing systematic techniques, developers can identify and resolve logic errors, ensuring the code produces the intended results.
Handling Null Pointer Exceptions
Null pointer exceptions are a common type of runtime error that occur when a program attempts to access an object or variable that is null or has not been initialized. These exceptions can lead to program crashes and unexpected behavior. Handling null pointer exceptions properly is crucial for ensuring the stability and reliability of software. Here are some techniques for handling null pointer exceptions:
- Identify Null References: Analyze the code and identify the specific locations where null references are being accessed. Look for variables or objects that may not have been properly initialized or have become null during runtime.
- Implement Null Checks: Before accessing a potentially null reference, use conditional statements to perform null checks. These checks will prevent the code from attempting to access null values, effectively avoiding null pointer exceptions.
- Throw Custom Exceptions: Instead of allowing null pointer exceptions to occur, consider throwing custom exceptions that provide more meaningful information about the specific context and cause of the null value. This can make the debugging process easier.
- Handle Exceptions with Try-Catch Blocks: Surround the code that may throw null pointer exceptions with try-catch blocks to handle the exceptions gracefully. This allows for more controlled error handling and prevents the program from abruptly crashing.
- Use Optional or Nullable Types: Utilize features in programming languages that support optional or nullable types. By using these types, you can explicitly indicate when a value may be null, forcing developers to handle null cases in their code.
- Implement Defensive Programming Techniques: Incorporate defensive programming practices by checking for null values at key points in the code. This can include assertions, validating inputs, and implementing error checks to catch potential null pointer exceptions early in the execution process.
- Properly Initialize Variables and Objects: Ensure that all variables and objects are properly initialized before they are used. This can help prevent null pointer exceptions caused by accidental references to uninitialized entities.
By handling null pointer exceptions effectively, developers can create more robust and reliable software. It is important to not only implement proper null checks but also adopt defensive programming practices to catch null references early. Thoroughly testing the code with various scenarios, including null inputs, can also help identify and resolve potential null pointer exceptions.
Remember, preventing null pointer exceptions is preferable to handling them after they occur. By adopting defensive programming practices and implementing proper null checks, developers can minimize the occurrence of null pointer exceptions, leading to more stable and resilient software.
Fixing Memory Errors
Memory errors are a common type of runtime error that can occur when a program fails to allocate or deallocate memory correctly. These errors can result in memory leaks, invalid memory accesses, or crashes. Fixing memory errors is essential for ensuring the proper functioning and stability of software. Here are some techniques for addressing memory errors:
- Review Memory Allocation: Examine the code to ensure that memory is allocated correctly. Check for functions such as ‘new’ or ‘malloc’ and verify that they are used appropriately and consistently.
- Check for Memory Leaks: Identify any potential memory leaks in the code, which occur when memory is allocated but not properly released. This can lead to excessive memory consumption over time. Review the code to ensure that memory is freed when it is no longer needed.
- Use Proper Memory Deallocation: Make sure that memory is deallocated when it is no longer required. Release memory using functions like ‘delete’ or ‘free’ in a timely manner to avoid memory errors.
- Avoid Invalid Memory Access: Prevent accessing memory that has been already released or is out of bounds. This can lead to undefined behavior or crashes. Validate memory accesses and ensure that variables are used within their allocated memory bounds.
- Check Pointers and References: Verify that pointers and references are properly initialized, not dangling, and not pointing to deleted memory. Incorrect usage of pointers and references can lead to memory errors. Ensure that they are set to valid memory locations before accessing them.
- Perform Memory Profiling: Use memory profiling tools to analyze memory usage in the program. These tools can identify potential memory leaks or excessive memory consumption, aiding in the identification and resolution of memory errors.
- Utilize Memory Management Techniques: Implement appropriate memory management techniques, such as smart pointers or garbage collection, depending on the programming language or framework being used. Using these techniques can automate memory handling and reduce the likelihood of memory errors.
Fixing memory errors requires careful review of the code to identify instances of improper memory allocation or deallocation. It is crucial to release memory when it is no longer needed and avoid accessing memory that has been freed. Adopting proper memory management techniques and utilizing memory profiling tools can help detect and resolve memory errors.
Regular testing and debugging can also assist in identifying memory errors. By running the program with different inputs and monitoring memory usage, developers can catch memory-related issues early on and apply the necessary fixes.
By addressing memory errors, developers can improve the efficiency and stability of their software, resulting in a more reliable user experience.
Resolving Stack Overflow Errors
Stack overflow errors are a type of runtime error that occur when the call stack, which stores function calls and local variables, exceeds its allocated memory. This usually happens when a recursive function fails to have a proper base case, causing an infinite loop of function calls. Resolving stack overflow errors is crucial for ensuring the proper execution and stability of the program. Here are some techniques to address stack overflow errors:
- Review Recursive Function: If the stack overflow error is caused by a recursive function, carefully review the function’s implementation. Make sure that the recursive calls have a valid termination condition, also known as the base case. Ensure that the base case is reached within a reasonable number of iterations to prevent excessive memory usage.
- Optimize Recursive Algorithm: Analyze the recursive algorithm and look for opportunities to optimize it. Consider alternative iterative or dynamic programming approaches that may reduce the level of recursion. Transforming a recursive algorithm into an iterative one can help prevent stack overflow errors.
- Increase Stack Size: In some cases, the stack size allocated for the program may be insufficient for the recursive function’s needs. Adjusting the stack size can provide more memory space for function calls. However, this should be used as a last resort and with caution, as it may have implications for the overall memory usage of the program.
- Tail Recursion: If supported by the programming language or compiler, consider implementing tail recursion. In tail recursion, the recursive call occurs at the end of the function, allowing the compiler to optimize it into a loop. This can help prevent stack overflow errors.
- Iterative Conversion: If possible, convert the recursive function into an iterative one. Iterative algorithms use loops instead of recursion to achieve the desired result. This can help avoid excessive function calls and stack overflow issues.
- Enhance Recursion Efficiency: Improve the efficiency of the recursive function by optimizing calculations, avoiding redundant operations, or implementing memoization techniques. These enhancements can help reduce the number of recursive calls and alleviate stack overflow errors.
It is important to note that preventing stack overflow errors is preferable to resolving them after they occur. By carefully designing recursive functions, considering termination conditions, and optimizing the algorithm, developers can minimize the risk of stack overflow errors.
Regular testing of the program with various input scenarios can help identify stack overflow issues early on. Monitoring memory usage and applying debugging techniques can assist in pinpointing the root cause of stack overflow errors. By addressing stack overflow errors, developers can ensure the program operates within its memory limits and provides a more stable execution environment.
Debugging Techniques for Runtime Errors
Debugging is a critical process for identifying and resolving runtime errors in software development. Whether it’s a syntax error, logic error, or memory error, effective debugging techniques can help uncover the root cause of the issue. Here are some techniques to assist in debugging runtime errors:
- Utilize a Debugger Tool: Debuggers allow developers to step through the code, line by line, and observe the values of variables and expressions at runtime. They provide a valuable way to track and analyze the program’s execution. By setting breakpoints and examining the state of the program during execution, developers can pinpoint the exact location and cause of the runtime error.
- Read Error Messages: Error messages often provide useful information about the nature of the runtime error. They can indicate the specific line of code where the error occurred, the type of error, and sometimes even suggestions for resolution. Carefully reading and understanding error messages can provide insights into the source of the error and guide debugging efforts.
- Print Debugging: Inserting print statements throughout the code can be a quick and effective way to trace the program’s execution and identify the problematic sections. Print statements can display variable values, control flow, and other relevant information. By strategically placing print statements, developers can narrow down the location and context of the runtime error.
- Review Logs and Stack Traces: Logs and stack traces can provide valuable information about the sequence of events leading up to the runtime error. Reviewing these can help identify the series of function calls and the states of variables at each step. Analyzing logs and stack traces assists in understanding the flow of the program and aids in pinpointing the cause of the error.
- Isolate the Problem: When encountering a runtime error, it is essential to isolate the problem by narrowing down the section of the code where the error occurs. This can be done by systematically disabling or debugging different parts of the code. By isolating the problem area, developers can focus their debugging efforts and avoid unnecessary analysis of unaffected code.
- Reproduce the Error: Reproducing the error is crucial for understanding and resolving it. Identify the specific inputs or conditions that trigger the runtime error and create test cases that reproduce the issue. By running the program with these selected inputs, developers can observe the error in a controlled environment, making it easier to diagnose and fix the underlying problem.
It’s important to combine multiple debugging techniques to effectively tackle runtime errors. Developers should leverage the power of debugging tools, such as debuggers and logging frameworks, while also employing traditional techniques like print debugging and analyzing error messages. By leveraging these techniques, developers can gain a deeper understanding of the runtime error and successfully resolve it.
Remember to approach debugging systematically, focusing on one issue at a time, and documenting any findings and solutions. With persistence and a methodical approach, developers can overcome runtime errors, ensuring the software operates as intended.
Using a Debugger Tool
Debugging is an essential step in resolving runtime errors, and a debugger tool is a powerful asset in the process. Debugger tools provide developers with the ability to step through the code, monitor variables, and track program execution in real-time. Here are some key advantages and techniques for using a debugger tool:
Stepping through the Code: Debuggers allow developers to execute the code line by line, allowing for a detailed examination of how the program flows. Stepping through the code helps identify the exact point where a runtime error occurs, providing insight into the variables’ values and the sequence of function calls. By examining the code’s execution step-by-step, developers can spot logic errors and unexpected behaviors.
Setting Breakpoints: Debuggers enable developers to set breakpoints, which are specific lines of code where the execution will pause. Breakpoints are useful for focusing on problem areas or functions of interest. Once the breakpoint is hit, developers can inspect variables and check if they hold the expected values at that point in the code. This allows for targeted debugging and helps narrow down the cause of the runtime error.
Inspecting Variables: Debuggers provide a view of the program’s variables and their values at any given point during execution. Being able to examine variables’ states helps identify incorrect assignments or unexpected behavior. Developers can inspect variables, modify their values, and observe the effects in real-time. This helps in understanding how the code manipulates and interacts with data, aiding in fixing runtime errors.
Conditional and Data Breakpoints: Debugger tools allow for the creation of conditional breakpoints based on certain conditions being met. This feature is particularly useful when trying to narrow down a specific runtime error occurring under specific circumstances. Additionally, data breakpoints can be set on specific variables, triggering a breakpoint when the variable value changes. These types of breakpoints can be powerful tools for debugging complex runtime errors.
Tracing and Call Stacks: Debuggers provide information about the call stack, which shows the sequence of function calls leading up to the error. This feature allows developers to trace the path of execution and identify the sequence of events that led to the error. By analyzing the call stack, developers can gain a better understanding of the code’s flow and identify any unexpected or incorrect function calls.
Interaction with Threads: For multi-threaded programs, debuggers enable developers to observe and control the execution of multiple threads simultaneously. This feature assists in detecting race conditions, deadlocks, and synchronization issues that can cause runtime errors. Being able to visualize and manipulate threads helps in diagnosing and solving thread-related issues effectively.
When using a debugger tool, it is important to have a good understanding of the code and the expected behavior to identify any discrepancies. Combining the capabilities of the debugger tool with other debugging techniques, such as analyzing error messages and logs, enables developers to efficiently uncover and resolve runtime errors.
Overall, a debugger tool is an invaluable asset for developers when it comes to debugging runtime errors, as it offers a comprehensive set of features and insights into the code’s execution process, ultimately leading to more efficient and effective debugging.
Reading Error Messages
Error messages are valuable sources of information when debugging runtime errors. They provide insights into the nature of the error, the location in the code where it occurred, and often suggestions for resolving the issue. Understanding how to read and interpret error messages is crucial for effectively diagnosing and fixing runtime errors. Here are some strategies for reading error messages:
Read the Entire Message: Begin by reading the error message in its entirety. Pay close attention to every detail, including any specific error codes, error descriptions, and the line number or file where the error occurred. Gather as much information from the error message as possible before proceeding with the debugging process.
Identify the Type of Error: Error messages often indicate the type of error that has occurred. Common types include syntax errors, logic errors, null pointer exceptions, and memory errors. Knowing the type of error can help direct your debugging efforts and give you a general idea of what to look for in the code.
Look for Specific Error Details: Error messages may provide additional details related to the error, such as the values of variables involved, the expected behavior, or any conditions that triggered the error. These details can be invaluable for understanding the specific context in which the error occurred and identifying potential causes.
Identify the Location of the Error: Error messages often specify the line number, file, or function where the error occurred. Use this information to navigate to the corresponding section of code. Keep in mind that the error may not always be directly at the location mentioned but could be a result of preceding code or related operations.
Consider Error Suggestion or Solution: Error messages sometimes provide suggestions or potential solutions for resolving the error. These suggestions can point you in the right direction and provide guidance on possible fixes. Take note of these suggestions and consider implementing them as part of your debugging process.
Search for the Error Online: If the error message is not clear or you need more information, search for the error message online. Chances are, someone else may have encountered the same issue, and there may be resources, forums, or Stack Overflow posts discussing the error and suggesting solutions. These online resources can provide valuable insights and help you resolve the error more efficiently.
In summary, error messages contain important clues that help diagnose and resolve runtime errors. By carefully reading and analyzing error messages, identifying the type of error, gathering specific details, and considering any provided suggestions, developers can gain a clearer understanding of the error’s cause and implement appropriate fixes.
Reviewing Logs and Stack Traces
Logs and stack traces are valuable sources of information when debugging runtime errors. They offer insights into the sequence of events leading up to the error, the state of the program at each step, and the function calls that were made. Reviewing logs and stack traces can help pinpoint the root cause of the error and guide the debugging process. Here are some strategies for effectively reviewing logs and stack traces:
Enable Sufficient Logging: Ensure that your code includes appropriate logging statements that capture relevant information at critical points in the program’s execution. Logging can provide details about variable values, function calls, and any intermediate steps leading up to the error. Enabling logging levels and including timestamps can aid in correlating events with the error occurrence.
Identify Error Patterns: Analyze multiple log entries or stack traces to identify common patterns. Look for similarities in the sequence of operations preceding the error, as this can help identify potential causes. Patterns may involve specific data inputs, specific user actions, or certain environmental conditions that consistently trigger the error.
Focus on Relevant Log Entries: Pay attention to log entries or stack traces that occur just before the error. These entries may contain information about actions or events that directly contribute to the error. By closely examining the context surrounding the error, you can gather crucial information that leads to a deeper understanding of the issue.
Analyze Variable States: Within the stack trace or log entries, closely inspect the values of relevant variables. Identify any unexpected or incorrect values that could have led to the observed runtime error. Comparing the expected states with the actual states of variables can provide insights into the code’s behavior and potential causes of the error.
Follow the Execution Flow: Trace the execution flow in the stack trace or log entries to understand how the program reached the error condition. Follow the sequence of function calls and examine the arguments and return values at each step. This process helps identify the specific function or module responsible for the error.
Consider Exception Messages: Stack traces often include exception messages that provide additional information about the error, such as the exception type and a descriptive message. These messages can help identify the specific nature of the error and provide clues about its origin. Pay close attention to this information when reviewing stack traces.
Correlate Logs with User Actions: If the runtime error is user-triggered, correlate the logs or stack traces with the actions performed by the user. Identify the specific user inputs or interactions that led to the error and analyze how the program handled those inputs. This can help uncover specific scenarios or conditions that result in the error.
By reviewing logs and stack traces with a meticulous and analytical mindset, developers can gain valuable insights into the runtime error. These insights are instrumental in understanding the flow of the program and the specific factors contributing to the error. Effective analysis of logs and stack traces reduces debugging time and leads to faster resolution of runtime errors.
Writing Test Cases
Writing test cases is an essential practice in debugging and preventing runtime errors. Test cases provide a systematic and structured approach to validate the behavior of a program under various scenarios, including edge cases and exceptional conditions. By writing comprehensive test cases, developers can identify and fix runtime errors early in the development process. Here are some strategies for writing effective test cases:
Cover Different Scenarios: Consider different scenarios and inputs that the program should handle. This includes normal cases, boundary cases, and exceptional cases. By covering a wide range of scenarios, you ensure that the program is robust and can handle varying conditions without encountering runtime errors.
Test Inputs and Outputs: Design test cases to cover different possible inputs and verify that the corresponding expected outputs are obtained. This can include testing with both valid and invalid inputs. By validating inputs and verifying outputs, you can catch potential errors related to calculations, conversions, or unexpected behaviors.
Target Edge Cases: Focus on edge cases where the input is at the extreme ends of its allowed range or when the program’s behavior can change significantly. Edge cases often uncover hidden bugs or reveal unforeseen runtime errors that may not be apparent during normal testing.
Exercise Exceptional Conditions: Test scenarios that trigger exceptional conditions such as network failures, file system errors, or resource unavailability. Simulating these exceptional conditions helps ensure that the program can handle these scenarios gracefully and avoids unexpected crashes or runtime errors.
Include Negative Testing: Test cases should include negative scenarios to ensure proper error handling and prevention of runtime errors. This involves intentionally providing invalid or unexpected inputs to verify that the program correctly identifies and handles such cases without encountering runtime errors.
Automate Test Execution: Automating the execution of test cases facilitates regular and systematic testing. This allows for easy regression testing and the ability to catch any potential runtime errors introduced during code changes or refactoring. Tools such as test frameworks or scripting languages can be used to automate the execution of test cases.
Verify Expected Error Messages: In some cases, test cases should explicitly verify that the correct error messages or exceptions are thrown when expected. This ensures that the program’s error handling mechanisms are working as intended and can help identify and fix potential runtime errors.
Document and Maintain Test Suites: Maintain a documented collection of test cases and their expected results. This helps in retesting and regression testing as new code is added or existing code is modified. Additionally, keeping the test suite up to date with evolving requirements ensures that potential runtime errors are continuously identified and resolved.
By writing comprehensive and diverse test cases, developers can identify and address runtime errors early on. Thorough testing enhances the stability and reliability of the software, ensuring that potential errors are caught and resolved before deployment. Additionally, writing test cases fosters a culture of quality and helps prevent recurrent runtime errors in the future.
Exception Handling Best Practices
Exception handling is a critical aspect of writing robust and reliable code. It allows developers to gracefully handle runtime errors and prevent program crashes. By following best practices for exception handling, developers can improve the stability and maintainability of their software. Here are some key best practices to consider:
Use Specific Exceptions: Instead of using generic catch-all exceptions, use specific exception types that accurately describe the error situation. This enables more targeted error handling and provides better contextual information for debugging and troubleshooting.
Handle Exceptions at the Right Level: Handle exceptions at the appropriate level in the code. Catch exceptions close to the point where they occur and handle them at a level of abstraction that makes sense for the application’s architecture. This helps in localizing and addressing the errors more effectively.
Fail Fast: Fail fast by throwing appropriate exceptions as soon as an exceptional condition is detected. This helps prevent the code from continuing in an inconsistent or erroneous state, minimizing the impact of the error and simplifying the debugging process.
Provide Meaningful Error Messages: Include informative error messages in the exceptions. Error messages should describe the error situation and provide any relevant context or insights into the cause of the exception. Meaningful error messages facilitate debugging and make it easier to diagnose and resolve the error.
Avoid Swallowing Exceptions: Avoid suppressing or swallowing exceptions without proper handling. Swallowing exceptions without appropriate actions can hide important information and make it difficult to diagnose and fix underlying issues. Instead, log exceptions or propagate them up the call stack while recording essential details for analysis.
Wrap and Rethrow Exceptions: When catching exceptions, consider wrapping them in a custom exception and then rethrowing them. Wrapping allows you to add additional contextual information and helps maintain a clear and consistent exception hierarchy throughout the codebase.
Clean Up Resources Properly: Resources such as file handles, database connections, or network sockets should be released and cleaned up properly, even in the presence of exceptions. Utilize try-finally or try-with-resources blocks to ensure that resources are closed or disposed of correctly, even if an exception occurs.
Implement Logging and Error Reporting: Incorporate logging mechanisms to record exceptions and important information about error situations. Use logging frameworks to capture stack traces, error details, and contextual data for post-mortem analysis. Implement error reporting mechanisms to alert developers or system administrators of critical exceptions in production environments.
Test Exception Scenarios: Include test cases that cover exceptional scenarios to ensure that exceptions are properly handled. Test exceptional conditions such as null values, invalid inputs, or unexpected behavior. This helps in verifying that the exception handling mechanisms are functioning correctly and that runtime errors are appropriately managed and not causing unexpected side effects.
By following these exception handling best practices, developers can improve error handling capabilities and enhance the stability and reliability of their software. By handling exceptions gracefully and providing meaningful error messages, developers can diagnose and resolve runtime errors efficiently, leading to more robust and maintainable code.
Testing and Deploying Fixed Code
After fixing runtime errors in the code, it is crucial to thoroughly test and deploy the fixed code to ensure that the issues have been successfully resolved. Testing and deploying fixed code effectively is essential to maintain the stability and reliability of the software. Here are some key steps to consider:
Unit Testing: Conduct unit testing to validate the fixed code. Create test cases that cover the specific scenarios and conditions related to the fixed runtime errors. Ensure that the fixed code behaves as expected and does not introduce any new errors or unexpected behavior.
Integration Testing: Perform integration testing to verify that the fixed code interacts correctly with other components or modules. This ensures that the fixes have not caused any regressions or conflicts with the overall system.
Regression Testing: Conduct regression testing to ensure that the fixes have not inadvertently introduced new issues or broken existing functionality. Re-run previously successful test cases to verify that the fixed code does not negatively impact other parts of the system.
Test Edge and Boundary Cases: Pay close attention to edge and boundary cases that triggered the runtime errors initially. Verify that the fixed code handles these cases correctly and does not encounter any errors or unexpected behavior in similar scenarios.
Load and Performance Testing: If applicable, perform load and performance testing on the fixed code to ensure that it can handle the expected workloads without encountering runtime errors or performance degradation. Verify that the fixes have not introduced any scalability issues or bottlenecks.
Deploy to Test Environment: Deploy the fixed code to a test environment that closely resembles the production environment. Test the fixed code in an environment that closely mirrors the conditions under which it will operate when deployed to production.
Monitor and Review Logs: Monitor the fixed code in the test environment and review logs and error reporting to ensure that the runtime errors no longer occur. Analyze any logged errors or exceptions to verify that they have been mitigated by the fixes. This helps in identifying any remaining issues and ensuring their resolution.
Deploy to Production: Once the fixed code has been thoroughly tested and confirmed to be stable, it can be deployed to the production environment. Follow proper deployment procedures, taking into account any required backups, versioning, or rollback capabilities.
Monitor Post-Deployment: Keep an eye on the production environment after deploying the fixed code. Continuously monitor logs, error reports, and performance metrics to ensure that the runtime errors do not reoccur and that the fixes have not introduced any new issues.
Collect User Feedback: Encourage users to provide feedback on the fixed code. Gather their observations and experiences to verify that the runtime errors have been adequately resolved and to address any potential edge cases or specific user scenarios that may need further attention.
By paying careful attention to testing and deploying fixed code, developers can ensure that runtime errors have been effectively resolved and that the software remains stable and reliable. Thorough testing and proper deployment procedures are crucial in maintaining the health and performance of the software in production environments.