
Create a New Table in Google Docs
Google Docs is a powerful tool for creating and editing documents, and it provides an easy way to create tables for organizing your information. Whether you’re working on a project, planning an event, or simply need to organize data, creating a table in Google Docs can greatly enhance your productivity. In this section, we’ll guide you through the process of creating a new table in Google Docs.
To create a table in Google Docs, follow these simple steps:
- Open your Google Docs document or create a new one by clicking on the “+ New” button in your Google Drive.
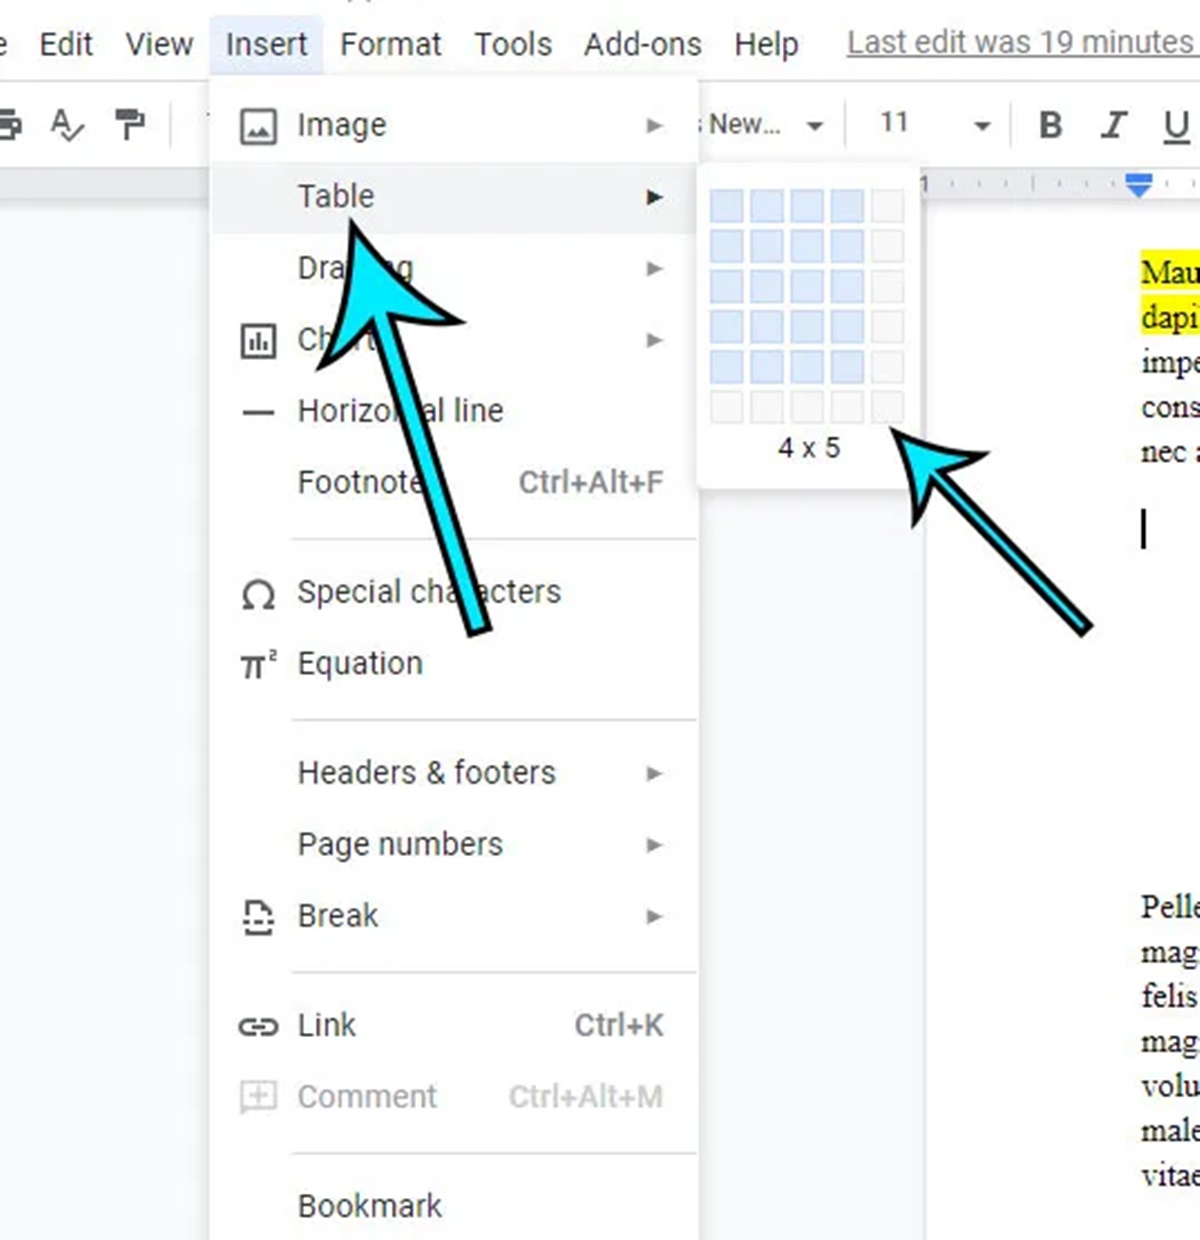
- Click on the “Table” option in the menu bar at the top of the page. A drop-down menu will appear.
- Select the number of rows and columns you want for your table. You can either click and drag to create a custom-sized table or choose a pre-set size.
- Once you’ve selected the size, the table will appear in your document. You can now enter your content into each cell of the table.
When creating a table, it’s important to consider the content you want to include and the overall layout you prefer. You can easily adjust the size and shape of the table later, so feel free to experiment with different options to find the one that works best for your needs.
Creating a new table in Google Docs is just the first step. In the following sections, we’ll explore how to customize and enhance your table by adding and formatting text, modifying rows and columns, applying borders and shading, and more. Stay tuned to learn about all the exciting features Google Docs has to offer for creating and editing tables!
Adjust the Size and Shape of Your Table
After creating a table in Google Docs, you may need to adjust its size and shape to ensure it fits your content perfectly. Google Docs provides several easy-to-use features that allow you to customize your table according to your specific requirements. In this section, we’ll explore how you can adjust the size and shape of your table in Google Docs.
Here are some useful techniques to modify the size and shape of your table:
- Resize the table: To resize the entire table, place your cursor on one of the outer corners until you see a bi-directional arrow. Click and drag the corner to increase or decrease the size of your table as needed.
- Modify column width: To adjust the width of a column, place your cursor on the edge of the column until you see the cursor change to a double-sided arrow. Click and drag to expand or shrink the column width.
- Change row height: To modify the height of a row, place your cursor on the edge of the row until you see the cursor change to a double-sided arrow. Click and drag to increase or decrease the height of the row.
- Insert or delete rows and columns: To add a new row or column, place your cursor on the row/column adjacent to where you want the new one inserted. Right-click and select the “Insert” option from the context menu. To delete a row or column, simply right-click on it and choose “Delete” from the context menu.
These simple adjustments can help you create a table that perfectly accommodates your content. By resizing, modifying column width, changing row height, and adding or deleting rows and columns, you have full control over the size and shape of your table.
Remember, while adjusting the size and shape of your table, ensure that the information remains clear and readable. Consider the amount of content you have and the desired layout, and make changes accordingly. Experiment with different configurations until you achieve the ideal table setup.
Now that you know how to adjust the size and shape of your table, let’s move on to the next section, where we’ll explore how to add and format text in your table to make it even more versatile and visually appealing.
Add and Format Text in Your Table
Adding and formatting text in your table is essential to make your data more organized and visually appealing. With Google Docs, you have a wide range of formatting options to customize the text in your table cells. In this section, we’ll guide you through the process of adding and formatting text in your table in Google Docs.
Here’s how you can add and format text in your table:
- Click inside a cell where you want to add or edit text.
- Type in your desired text. You can enter numbers, letters, or any other information you want to include.
- Once you’ve entered the text, you can apply various formatting options such as bold, italics, underline, font style, font size, and text alignment.
- To format the text, select the cell or cells you want to modify.
- Click on the toolbar options at the top to apply formatting changes to your selected text. For example, you can click the “B” icon to make the text bold, the “I” icon to italicize it, or the “U” icon to underline it.
- To change the font style or size, use the respective drop-down menus in the toolbar. You can also adjust the text alignment by selecting the alignment options.
By leveraging these formatting features, you can make your table more visually appealing and highlight important information effectively. However, it’s essential to use formatting sparingly and consistently for a clean and professional look.
In addition to basic formatting options, you can also customize the fill color and text color of your table cells. This can help you create a cohesive design and visually distinguish different sections within the table. Simply select the cell or cells you want to modify, click on the paint bucket icon in the toolbar, and choose the desired colors.
Remember, when adding and formatting text in your table, keep readability in mind. Ensure that the font size and style are clear and legible, especially if you have a large amount of data. Additionally, align the text properly within each cell to maintain consistency and improve overall table aesthetics.
Now that you know how to add and format text in your table, let’s explore the next section, where we’ll delve into adding and modifying rows and columns in Google Docs tables.
Add and Modify Rows and Columns in Your Table
As you work with your table in Google Docs, you may find the need to add or modify rows and columns to better organize your data or accommodate new information. Google Docs provides simple yet powerful tools that allow you to seamlessly add, delete, and adjust rows and columns in your table. In this section, we’ll walk you through the process of adding and modifying rows and columns in your table in Google Docs.
Here’s how you can add and modify rows and columns:
- Adding rows:
- To add a new row above an existing row, right-click on the row and select “Insert row above” from the context menu.
- To add a new row below an existing row, right-click on the row and select “Insert row below” from the context menu.
- Adding columns:
- To add a new column to the left of an existing column, right-click on the column and select “Insert column left” from the context menu.
- To add a new column to the right of an existing column, right-click on the column and select “Insert column right” from the context menu.
- Modifying rows and columns:
- To delete a row or column, right-click on it and select “Delete row” or “Delete column” from the context menu.
- To adjust the height of a row, place your cursor on the edge of the row until you see the cursor change to a double-sided arrow. Click and drag to increase or decrease the row height.
- To adjust the width of a column, place your cursor on the edge of the column until you see the cursor change to a double-sided arrow. Click and drag to expand or shrink the column width.
With these intuitive features, you can easily add and modify rows and columns to enhance the structure and flexibility of your table. Whether you need to insert new data or reorganize existing information, these options ensure smooth table management.
It’s important to maintain consistency when adding or modifying rows and columns. Ensure that the row heights and column widths are uniform, making your table visually appealing and easy to comprehend. Also, keep in mind the overall layout and readability of your table to ensure a seamless user experience.
Now that you know how to add and modify rows and columns in your table, let’s move on to the next section, where we’ll explore how to merge and split cells to further customize your table’s structure.
Merge and Split Cells in Your Table
In Google Docs, you have the ability to merge and split cells within your table, allowing you to customize the structure and organization of your data. The merge cells feature enables you to combine multiple cells into a single, larger cell, while the split cells feature allows you to divide a single cell into multiple smaller cells. In this section, we’ll guide you through the process of merging and splitting cells in your table in Google Docs.
Here’s how you can merge and split cells:
- Merging cells:
- Select the cells you want to merge. To select multiple cells, click and drag your cursor across the desired cells.
- Right-click on the selected cells and choose “Merge cells” from the context menu.
- The selected cells will now be merged into one larger cell covering the same area.
- Splitting cells:
- Select the cell that you want to split into smaller cells. You can only split a cell that was previously merged.
- Right-click on the selected cell and choose “Split cells” from the context menu.
- A dialog box will appear, allowing you to specify the number of rows and columns you want to split the cell into.
- After entering the desired values, click “OK” to split the cell into the specified number of smaller cells.
Merging and splitting cells can be particularly useful when you want to create headers, combine data from multiple cells, or reorganize your table layout. By merging cells, you can create larger cells that span multiple rows or columns, providing a clear visual hierarchy within your table. Conversely, splitting cells allows you to divide a large cell into smaller, more defined sections for better data organization.
It’s important to note that when you merge cells in a table, the merged cell takes on the formatting of the top-leftmost cell in the selection. Be cautious when merging cells with different formatting, as it may result in inconsistencies within the table. Ensure the content and formatting remain consistent and coherent.
Now that you know how to merge and split cells, let’s move on to the next section, where we’ll explore how to apply borders and shading to your table, further enhancing its visual appeal and clarity.
Apply Borders and Shading to Your Table
In Google Docs, you can apply borders and shading to your table to enhance its visual appeal and improve the readability of your data. Borders can help separate cells, create a clear structure, and highlight specific sections of your table. Shading, on the other hand, can add a touch of color or distinction to make your table more visually engaging. In this section, we’ll guide you through the process of applying borders and shading to your table in Google Docs.
Here’s how you can apply borders and shading to your table:
- Select the cells or the entire table to which you want to apply borders or shading. To select multiple cells, click and drag your cursor across the desired cells. To select the entire table, click on the top-left corner of the table.
- Once you’ve made your selection, click on the “Table” option in the menu bar at the top of the page.
- In the dropdown menu, hover over the “Table borders” option to reveal various border styles and options. Click on the preferred border style to apply it to your selected cells or table.
- To apply shading to your table, hover over the “Table cell background color” option in the dropdown menu. Choose a color from the available palette or use the “Custom” option for more color choices.
Using borders and shading in your table can help improve the overall clarity and organization of your data. Borders can create a distinct visual separation between cells, making the information easier to read and understand. Shading, on the other hand, can be used to group related information, highlight important sections, or simply add a visual element to make your table more aesthetically appealing.
As you apply borders and shading, it’s important to maintain consistency throughout your table. Ensure that the border styles and shading colors are used uniformly across similar sections or categories. This will help maintain a visually cohesive and professional look for your table.
Now that you know how to apply borders and shading to your table, let’s proceed to the next section, where we’ll explore how to sort and filter data in your table, allowing you to efficiently organize and analyze your information.
Sort and Filter Data in Your Table
Sorting and filtering data in your table can greatly enhance your ability to analyze, organize, and make sense of large amounts of information. In Google Docs, you have the option to sort data in ascending or descending order based on a specific column, as well as filter data to display only the information that meets certain criteria. In this section, we’ll guide you through the process of sorting and filtering data in your table in Google Docs.
Here’s how you can sort and filter data in your table:
- Select the entire column that you want to sort or filter. To select a column, click on the letter at the top of the column.
- Click on the “Data” option in the menu bar at the top of the page.
- In the dropdown menu, hover over the “Sort range” option to reveal sorting options.
- Choose whether you want to sort in ascending or descending order.
- Alternatively, you can click on the “Filter” option in the same dropdown menu to enable filtering.
- A filter icon will appear at the top of each column. Click on the filter icon for the column you want to filter.
- Choose the filter criteria to display only the data that meets those criteria.
Sorting data allows you to organize your table based on specific columns, making it easier to find, compare, and analyze information. Whether you want to sort numerical data from smallest to largest or sort names alphabetically, the sorting feature in Google Docs helps streamline your data arrangement process.
Filtering data, on the other hand, allows you to focus on specific subsets of information based on certain criteria. This is particularly useful when dealing with large datasets, as it enables you to view relevant data that meets specific conditions, such as filtering by date ranges or specific values in a column.
Remember, when sorting or filtering data, ensure that your table headings are descriptive and your data is accurately populated. This will ensure that the sorting and filtering results are meaningful and useful for your analysis.
Now that you know how to sort and filter data in your table, let’s move on to the next section, where we’ll explore how to use formulas and calculations in your table for more advanced data manipulation and analysis.
Use Formulas and Calculations in Your Table
Google Docs provides powerful spreadsheet functionality that allows you to use formulas and calculations in your table. These formulas enable you to automate calculations, perform mathematical operations, and analyze your data with ease. In this section, we’ll guide you through the process of using formulas and calculations in your table in Google Docs.
To use formulas and calculations in your table, follow these steps:
- Select the cell where you want the result of your calculation to appear.
- Begin the formula by typing “=” followed by the function or expression you want to use. For example, you can use basic arithmetic operations like addition (+), subtraction (-), multiplication (*), and division (/).
- Use cell references to include values from other cells in your calculation. You can specify a cell reference by typing the column letter followed by the row number, such as A1 or C4.
- You can also apply various built-in functions to perform more complex calculations. Functions such as SUM, AVERAGE, MAX, MIN, and COUNT can help you summarize data and obtain useful insights.
- Press Enter once you’ve completed the formula. The result of the calculation will appear in the selected cell.
By utilizing formulas and calculations in your table, you can automate repetitive tasks, perform complex calculations, and analyze data more efficiently. This allows you to save time and gain valuable insights from your data.
It’s important to carefully construct your formulas and ensure that cell references are accurate. By referencing the correct cells, you can ensure that your calculations are based on the appropriate data.
Furthermore, you can extend your formulas to apply them to multiple cells in a column or row by simply dragging the corner of the selected cell. This will automatically apply the formula to the rest of the selected range.
Now that you know how to use formulas and calculations in your table, let’s move on to the next section, where we’ll explore how to add images and links to your table to further enhance your document.
Add Images and Links to Your Table
Incorporating images and links in your table can enhance the visual appeal and functionality of your document. Google Docs allows you to easily insert images and create clickable links within your table to provide additional context or direct readers to relevant information. In this section, we’ll guide you through the process of adding images and links to your table in Google Docs.
Here’s how you can add images and links to your table:
- Inserting an image:
- Click on the cell where you want to add the image.
- Go to the “Insert” menu at the top of the page and select “Image”.
- Choose to insert an image from different sources – “Upload from computer”, “Search the web”, “Drive”, “Photos”, or “By URL”. Select the desired option and follow the prompts to add the image.
- Resize, reposition, or adjust the image properties by clicking on it and using the handles and formatting tools that appear.
- Creating a clickable link:
- Select the cell or text within a cell where you want to insert the link.
- Go to the “Insert” menu at the top of the page and select “Link”.
- In the dialog box that appears, enter the URL or web address of the website or document you want to link to.
- Optionally, you can customize the link text by editing it in the “Text to display” field.
- Click “Apply” to insert the link into the selected cell or text.
Adding images and links to your table allows you to enhance your documentation by incorporating visual elements and providing interactive access to external resources. It can be especially useful when creating data-driven reports, product catalogs, or collaborative documents.
Ensure that the images you choose are relevant, appropriately sized, and do not overwhelm the table. For clickable links, use descriptive and concise text that accurately represents the linked content and provides clear direction to the reader.
By seamlessly embedding images and links in your table, you can create a more engaging and informative document. Now that you know how to add images and links, let’s move on to the next section, where we’ll explore how to collaborate and share your table with others in Google Docs.
Collaborate and Share Your Table with Others
Google Docs allows for seamless collaboration, making it easy to work with others on your table in real time. Whether you’re collaborating on a team project, coordinating an event, or collecting data from multiple sources, Google Docs offers powerful collaboration features that enable multiple users to edit and contribute to the same table simultaneously. In this section, we’ll guide you through the process of collaborating and sharing your table with others in Google Docs.
Here’s how you can collaborate and share your table:
- Open your table in Google Docs.
- Click on the “Share” button at the top right corner of the page.
- In the sharing settings window, enter the email addresses of the people you want to collaborate with.
- Select the level of access you want to grant to each collaborator – “Can edit”, “Can comment”, or “Can view”.
- Optionally, you can add a custom message to the invitation.
- Click “Send” to share the table with your collaborators.
Once you’ve shared your table, your collaborators will receive an email invitation with a link to access and edit the document. They can make changes in real time, add comments, and work together simultaneously. All changes are automatically saved, ensuring that everyone has access to the most up-to-date version of the table.
In addition to real-time collaboration, Google Docs provides features such as version history, which allows you to review and restore previous versions of your table if needed. This ensures that you can easily track changes, revert to previous states, and maintain a comprehensive record of the document’s evolution over time.
Collaborating and sharing your table fosters effective teamwork, streamlines communication, and enables efficient data sharing. It’s an invaluable feature for both small-scale projects and large-scale collaborations, allowing teams to work together seamlessly regardless of geographical location.
Now that you know how to collaborate and share your table with others, you can leverage the power of Google Docs to enhance teamwork and productivity. Let’s move on to the final section, where we’ll wrap up the article and provide a recap of the key points covered.