
Task Manager in Windows
The Task Manager is a powerful software tool that comes built-in with the Windows operating system. Its primary function is to provide users with an overview of all the applications and processes currently running on their computer. Task Manager can be accessed by pressing Ctrl + Shift + Esc or by right-clicking the taskbar and selecting “Task Manager” from the context menu.
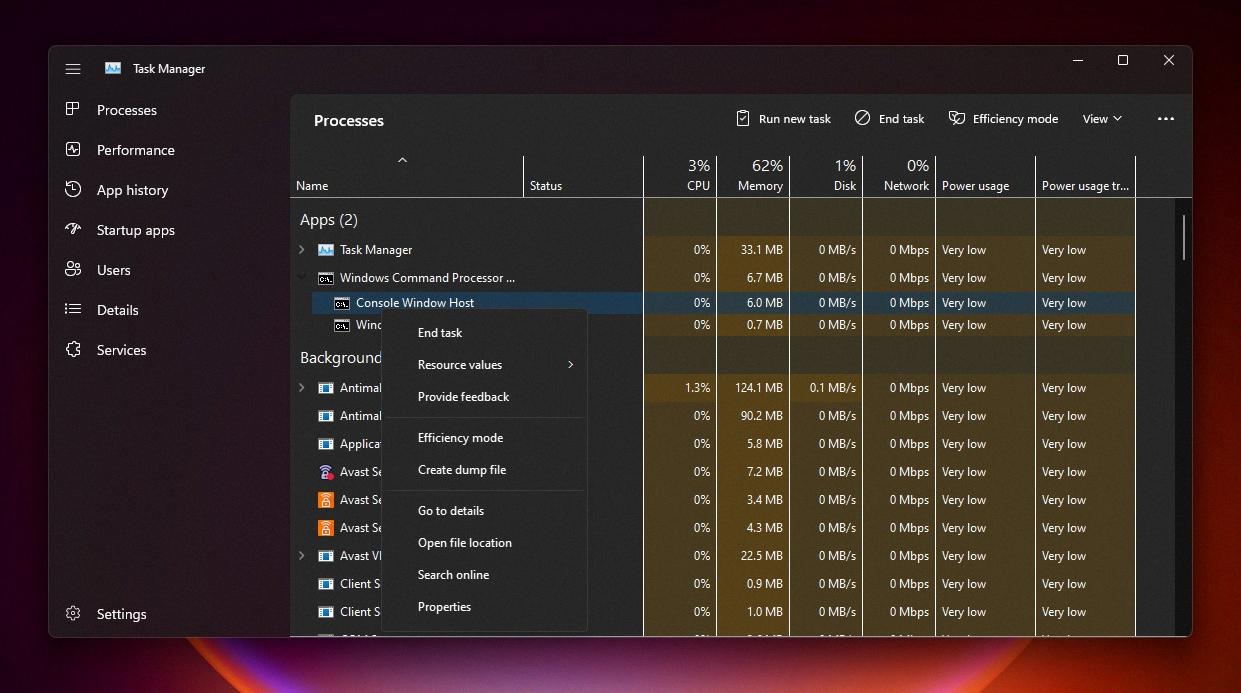
Once opened, the Task Manager displays several tabs, including “Processes,” “Performance,” “App history,” “Startup,” and more. The “Processes” tab is where you can find detailed information about the running applications and background processes. The table in this tab shows you the name of the process, its status, CPU and memory usage, and other relevant information.
One of the main advantages of the Task Manager is its ability to manage and control running processes. If you encounter an unresponsive application, you can select it in the Task Manager and click on the “End Task” button to force it to close. This can be particularly useful when an application freezes or stops responding.
Moreover, the Task Manager also allows you to monitor system performance in real-time. The “Performance” tab displays detailed graphs and statistics about CPU, memory, disk usage, and network activity. This information can help you identify any resource-hungry processes that may be slowing down your system.
Additionally, the Task Manager provides insights into the applications that launch when your computer starts up. The “Startup” tab lists all the programs that are configured to run at boot, allowing you to manage and disable unnecessary ones to improve startup time and system performance.
In summary, the Task Manager in Windows is an essential tool for monitoring and managing the applications and processes running on your computer. Whether you need to close a frozen application, analyze system performance, or optimize startup programs, the Task Manager provides a comprehensive set of features to help you maintain a smooth and efficient computing experience.
Activity Monitor in macOS
Activity Monitor is a powerful system utility tool that is built-in to macOS. Similar to the Task Manager in Windows, it offers a comprehensive overview of the applications and processes running on your Mac. You can access Activity Monitor by navigating to Applications > Utilities > Activity Monitor or by using the Spotlight search feature.
Upon opening Activity Monitor, you will be presented with a window that displays various tabs, including “CPU,” “Memory,” “Energy,” “Disk,” “Network,” and “Cache.” Each tab provides valuable insights into different aspects of your Mac’s performance and resource usage.
In the “CPU” tab, you can see a list of all running processes along with their CPU usage. This allows you to identify applications or processes that are consuming a significant amount of CPU resources. Additionally, you can sort the processes by various criteria such as CPU usage, process name, or memory usage to quickly find any resource-intensive programs.
The “Memory” tab provides information about the memory usage of applications and processes. You can see how much memory is being used by each process and identify any memory leaks or excessive memory consumption. This tab is especially helpful if you notice your Mac becoming slow or unresponsive.
Activity Monitor also offers insights into the energy consumption of applications through the “Energy” tab. This tab shows the energy impact of running processes, which can help you identify any resource-heavy applications that may be draining your battery quickly. By closing or quitting these energy-intensive apps, you can extend your battery life on a laptop or improve the overall power efficiency of your Mac.
Furthermore, the “Disk” and “Network” tabs allow you to monitor the disk usage and network activity of your Mac. You can see which processes are accessing your disk and network, helping you identify any potential performance bottlenecks or network-related issues.
In summary, Activity Monitor is a versatile tool for monitoring and managing the applications and processes running on your macOS. Whether you need to analyze CPU or memory usage, keep an eye on energy consumption, or monitor disk and network activity, Activity Monitor provides you with the necessary insights to maintain a smooth and efficient Mac experience.
System Monitor in Linux
Linux offers several system monitoring tools, and one of the most commonly used ones is the System Monitor. The System Monitor provides an intuitive graphical interface to monitor and manage the applications and processes running on your Linux system. It offers a wealth of information and can be accessed through the system menu or by typing “gnome-system-monitor” in the terminal.
Once opened, the System Monitor presents various tabs, including “Processes,” “Resources,” “File Systems,” “Network,” and “Applications.” Each tab provides detailed insights into different aspects of your Linux system’s performance and resource utilization.
The “Processes” tab displays a list of all running processes along with their CPU and memory usage. You can sort the processes by various columns such as CPU usage, memory usage, or process name to quickly identify any resource-intensive applications. Moreover, the System Monitor allows you to end or kill processes directly from the interface, giving you control over your system’s resources.
The “Resources” tab provides real-time information about the CPU, memory, and disk usage of your Linux system. You can view detailed graphs and statistics that help you understand how your system’s resources are being utilized. This tab is particularly useful when troubleshooting performance issues or monitoring the impact of resource-intensive applications on your system.
The “File Systems” tab displays information about your Linux system’s storage devices and their usage. You can see the amount of free and used space on each partition, as well as the mount point and file system type. This tab allows you to keep track of your disk usage and identify any partitions that are running low on space.
The “Network” tab offers insights into network activity, including data sent and received by your system. You can see the network usage of individual processes and monitor network connections in real-time. This tab can be useful in troubleshooting network-related issues or identifying any unusual network activity on your Linux system.
Additionally, the System Monitor provides the “Applications” tab, which displays a list of currently running applications. This allows you to easily switch between open applications or close any unresponsive ones without the need to navigate through different windows or menus.
In summary, the System Monitor in Linux is a valuable tool for monitoring and managing the applications and processes running on your Linux system. Whether you need to analyze process usage, monitor system resources, track disk usage, observe network activity, or manage applications, the System Monitor provides you with the necessary information and controls to optimize your Linux experience.
Resource Monitor in Windows
Resource Monitor is a powerful tool that is built into Windows operating systems, starting from Windows Vista. It provides in-depth insights into the resource utilization and performance of your computer. By monitoring various system resources, such as CPU, memory, disk, and network, Resource Monitor helps you identify and resolve performance issues effectively. You can access the Resource Monitor by searching for “Resource Monitor” in the Start menu or using the shortcut Windows key + R, then typing “resmon.”
Once opened, Resource Monitor presents several tabs, including Overview, CPU, Memory, Disk, Network, and more. These tabs provide detailed real-time data and metrics for different categories of resources.
The Overview tab provides a comprehensive summary of your computer’s resource utilization. You can quickly see the percentage of CPU, memory, disk, and network utilization, as well as the number of running processes and the performance details of each category.
The CPU tab in Resource Monitor displays a list of running processes and their respective CPU usage. It allows you to sort the processes by CPU usage, obtain detailed information on the processes, and identify any applications or processes that are putting a strain on your CPU resources.
The Memory tab shows the memory usage of processes and provides information on the working set, committed, and shared memory of each process. This tab allows you to monitor how much memory each application or process is using and helps identify memory-intensive applications or potential memory leaks.
Resource Monitor’s Disk tab provides comprehensive information about disk performance, including disk activity, disk response time, and the top processes utilizing disk resources. It enables you to monitor read and write activity, track the busiest disk processes, and identify any disk-related bottlenecks affecting your computer’s performance.
The Network tab displays real-time network activity, including the processes responsible for network communication, the amount of data sent and received, and network connection details. You can monitor individual processes’ network usage and identify any applications or processes that might be consuming excessive network bandwidth.
In addition to these primary tabs, Resource Monitor offers other useful features, such as the “Associated Handles” tab, which displays the specific files and resources accessed by each process, and the “Services” tab, which provides insights into the services running on your system.
Resource Monitor in Windows is an invaluable tool for monitoring and managing system resources. It enables you to identify resource-intensive processes, troubleshoot performance issues, and optimize your computer’s performance effectively.
Process Explorer in Windows
Process Explorer is a powerful utility tool developed by Microsoft that offers an advanced and in-depth view of the processes running on a Windows computer. It provides detailed information and insights into active processes, including their dependencies, CPU usage, memory usage, and more. Process Explorer can be downloaded from the Microsoft website and run as a standalone application without requiring installation.
When launched, Process Explorer displays a tree-like structure of all running processes, including their child processes and associated modules. Each process is represented with its own color-coded icon, making it easy to distinguish between different types of processes. By exploring the tree hierarchy, you can gain a comprehensive understanding of how processes and their dependencies are interconnected.
One of the key features of Process Explorer is the ability to view extensive information about individual processes. By simply hovering the cursor over a process, a tooltip will appear, providing details such as the full path of the executable, process ID, CPU usage, memory usage, and more. This level of granularity allows you to pinpoint resource-intensive processes and identify any abnormalities in their behavior.
Besides providing information, Process Explorer also assists in troubleshooting issues related to processes. It allows you to suspend or terminate specific processes, making it useful when dealing with unresponsive or misbehaving applications. Additionally, Process Explorer provides a search functionality to easily locate specific processes or modules, saving you time when tracking down a particular process of interest.
Another powerful feature of Process Explorer is its ability to display which processes have specific files or registry keys open. This can be extremely helpful in identifying potential conflicts or issues that arise from multiple processes accessing the same resources simultaneously.
Furthermore, Process Explorer provides a comprehensive set of tools for analyzing the performance of processes and system resources. It includes graphs and real-time monitoring of CPU usage, memory usage, and I/O usage, allowing you to correlate resource consumption with specific processes.
In summary, Process Explorer is an essential tool for advanced process management and analysis on Windows systems. Its extensive features and detailed insights into processes and resources make it invaluable for troubleshooting, optimizing performance, and gaining a deeper understanding of how your system functions.
htop in Linux
htop is a powerful command-line process viewer and system monitor tool available for Linux systems. It serves as an excellent alternative to the traditional ‘top’ command, offering a more interactive and user-friendly interface. htop provides real-time insights into system resources, process management, and performance monitoring, making it a valuable tool for system administrators and power users.
Upon launching htop in the terminal, you are presented with a well-organized and intuitive display of system information. The top section provides crucial details about CPU usage, memory usage, and system uptime at a glance. It offers easy-to-read color-coded bars and graphs to visualize resource consumption, allowing you to quickly identify any bottlenecks or excessive resource usage.
In the process list section, htop presents a dynamically updating table that displays all running processes. Each process is listed with its process ID (PID), user, CPU usage, memory usage, and other relevant information. You can easily sort the list based on specific columns, such as CPU or memory usage, to prioritize resource-intensive processes.
One of the notable features of htop is its user-friendly interface for process management. You can efficiently perform actions like killing processes, changing process priority, and renicing processes directly from the htop interface. By selecting a process and utilizing the appropriate function key, you can send signals to processes or adjust their priority levels effortlessly.
htop also offers comprehensive system monitoring capabilities. By navigating through different tabs, you can track system load, monitor network activity, and view disk usage. The Network tab provides real-time information about network traffic for each network interface, while the Disk tab displays disk usage statistics for mounted partitions. These features empower you to monitor system performance and identify any potential performance issues or resource constraints.
In addition to its rich functionality, htop provides extensive customization options. You can fine-tune the display settings, select which columns to show or hide, and customize the colors and layout according to your preferences. htop also supports mouse interactions, making it even more convenient to browse through processes and navigate the interface.
In summary, htop is a powerful and versatile command-line process viewer and system monitor tool for Linux. Its user-friendly interface, real-time updates, and comprehensive set of features make it an invaluable asset for enhancing system performance, managing processes, and gaining insights into system resource utilization.
top in macOS and Linux
top is a command-line utility available in both macOS and Linux operating systems that provides real-time information about system resource usage and process management. It allows users to monitor the CPU, memory, and other system statistics, making it a valuable tool for system administrators and advanced users.
When executed in the terminal, top displays a dynamic and interactive list of active processes. The default view presents a table with columns showing information such as process ID (PID), CPU usage, memory usage, and more. Each process is listed in descending order based on CPU usage, allowing users to quickly identify resource-intensive processes.
top continuously updates the displayed information in real-time, providing a live view of system resource utilization. It refreshes at regular intervals, allowing users to monitor changes in CPU usage, memory usage, and other metrics. By default, the displayed updates occur every few seconds, but this can be adjusted to fit specific requirements or preferences.
One of the key features of top is its ability to display summary information about system resource usage. It provides an overview of the total CPU usage, system-level statistics, as well as the number of running processes. Additionally, top provides information on the load average, which indicates the level of processor usage over a specific period.
top allows for convenient customization and sorting of the displayed information. Users can choose to display or hide specific columns to focus on the relevant metrics. Furthermore, top supports sorting the process list based on various criteria, such as CPU usage, memory usage, or process name, enabling users to prioritize processes based on their resource consumption.
Another powerful feature of top is its ability to manage and control processes. It allows users to send signals to processes, such as terminating or suspending them, directly from the top interface. By selecting a process and using the appropriate key, users can perform various actions to manage and manipulate processes, providing greater control over system resources.
top is a versatile and essential tool for monitoring system resource usage and managing processes in both macOS and Linux. Its command-line interface may require some familiarity and understanding, but its real-time updates, customizable display, and process management capabilities make it an invaluable utility for analyzing and optimizing system performance.
ps command in macOS and Linux
The “ps” command is a widely used command-line utility in both macOS and Linux operating systems. It provides detailed information about active processes running on the system. The “ps” command stands for “process status” and allows users to monitor and manage processes effectively.
When executed in the terminal, the “ps” command displays a list of active processes. By default, it shows a limited set of information, such as the process ID (PID), terminal associated with the process, CPU usage, and command name. This basic view provides a quick overview of the running processes.
One of the key features of the “ps” command is its extensive range of options that allow users to customize the displayed information. These options enable users to choose specific columns to display, such as process status, memory usage, start time, and more. By leveraging these options, users can tailor the output to their specific requirements and gain deeper insights into the system’s process landscape.
Another valuable aspect of the “ps” command is its ability to filter processes based on various criteria. Users can utilize flags and parameters to selectively display only processes that match certain conditions. For example, it is possible to filter processes by user, process name, parent process ID (PPID), or even by specific terminal.
The “ps” command also supports displaying processes in a hierarchical manner. By using options like “H” (forest view) or “f” (full view), users can visualize the relationship between parent and child processes, allowing for a better understanding of process dependencies.
Furthermore, the “ps” command allows users to track resource usage by specifying appropriate options. For instance, the “-o” option enables users to choose and display specific resource usage information, such as CPU utilization, memory consumption, or thread count. This can be particularly useful when troubleshooting performance issues or monitoring resource-intensive applications.
The “ps” command is scriptable and can be incorporated into shell scripts or command pipelines. By combining the “ps” command with other commands and utilities, users can build complex commands and automate system monitoring or process management tasks.
In summary, the “ps” command is a versatile and powerful tool for examining and managing processes in macOS and Linux. With its range of options, the “ps” command provides detailed insight into the running processes, allowing users to monitor resource usage, filter processes based on criteria, and customize the output to suit their needs.
Finder in macOS
Finder is the default file management application in macOS, providing users with a graphical interface to navigate and manage files and folders. It serves as the central hub for accessing and organizing documents, applications, media files, and more on a Mac. Finder offers a user-friendly and intuitive experience, making it easy for users to locate, manipulate, and interact with their files and directories.
Upon launching Finder, the interface displays a sidebar on the left side, which includes commonly used folders such as Documents, Downloads, Music, and Pictures, as well as shortcuts to external drives and network locations. This design allows users to quickly access frequently accessed folders and drives, streamlining the file navigation process.
The main window of Finder provides a detailed view of the selected folder or directory contents. Users can choose to display files as icons, a list, columns, or in a gallery view, depending on their preferences. The customization options make it easy to find the most suitable view for managing files efficiently.
Finder offers a suite of features to help users search for specific files and folders. The search bar in the top-right corner allows users to enter keywords or file attributes to refine their search. Additionally, Finder supports advanced search criteria, such as file type, creation date, and modification date, helping users locate files based on specific parameters.
Drag-and-drop functionality is a prominent feature of Finder. Users can easily move files and folders by dragging them from one location to another within Finder or to other applications for quick file sharing or attachment. The simplicity and intuitiveness of drag-and-drop make file management seamless and efficient.
Finder also provides additional features for managing files, such as file previews, Quick Look, and file information. Users can preview file contents without opening them, making it convenient to browse through documents, images, or media files. Quick Look allows users to get a closer look at a file’s contents without launching its associated application. Additionally, Finder displays detailed information about files and folders, including file size, type, and modification date, making it easier to identify and organize files.
Furthermore, Finder gives users the ability to create and organize folders, rename files, and delete items. It also supports tagging, allowing users to assign labels and metadata to files for easy and intuitive organization. These features enhance file management and make it easier to locate and access files when needed.
In summary, Finder is an essential file management application in macOS, offering a user-friendly interface and a variety of features for navigating, organizing, and accessing files and folders. Its intuitive design, search capabilities, drag-and-drop functionality, and additional file management tools make it a powerful tool for macOS users to efficiently manage their files and directories.
Dock in macOS
The Dock is a prominent feature of the macOS graphical interface, offering quick access to frequently used applications, files, and folders. Located at the bottom of the screen by default, the Dock provides a convenient and efficient way for users to launch applications, switch between open windows, and access important files and folders.
The Dock is highly customizable, allowing users to add or remove applications, folders, and documents according to their preferences and workflow. Applications can be easily added to the Dock by dragging their icons from the Applications folder or directly from the Finder. Users can also remove items from the Dock by dragging them off the Dock and releasing the mouse button.
By default, the Dock displays icons for commonly used applications, such as Finder, Safari, Mail, and more. These icons can be rearranged to suit individual preferences. Users can click on an application icon in the Dock to launch the application or, if the application is already open, to switch to the application’s open window. This allows for quick and efficient multitasking, making it easy to switch between applications and work on multiple tasks simultaneously.
In addition to applications, the Dock allows users to add folders for easy access to frequently used directories. This is particularly useful for quick access to important files or project folders. Users can simply drag and drop folders onto the Dock to add them. Clicking on a folder icon in the Dock opens a window displaying the contents of the folder, providing quick access to its contents.
The Dock also provides various customization options, such as adjusting the size of the icons in the Dock or enabling the magnification effect, which enlarges the icons when the cursor hovers over them. Users can access these customization options by right-clicking on the dividing line of the Dock and selecting “Dock Preferences.”
Furthermore, the Dock features a persistent area on the right side known as the “Trash.” Users can drag files and folders onto the Trash icon to delete them, or they can right-click on the Trash icon to access additional options, such as restoring trashed items or emptying the Trash.
In summary, the Dock is a central element of the macOS interface, providing quick and easy access to frequently used applications, folders, and files. Its customization options, easy application launching and switching, and convenient access to important files make it an integral part of the macOS user experience, enhancing productivity and workflow efficiency.
Taskbar in Windows
The Taskbar is a central navigation and task management tool in the Windows operating system. Located at the bottom of the screen by default, the Taskbar provides quick and easy access to frequently used applications, system functions, and notifies users of important system events. It is an essential component of the Windows user interface, allowing users to efficiently manage their tasks and workflow.
By default, the Taskbar features the Start button on the left side, which provides access to the Start menu when clicked. The Start menu serves as a central hub for launching applications, accessing system settings, and performing various tasks. Users can customize the Start menu by pinning frequently used applications for quick access or organizing programs into categories.
The Taskbar also displays icons for currently running applications, making it easy to switch between them. When an application is running, its icon appears on the Taskbar, and clicking on the icon brings the application’s window to the forefront of the screen. This makes it convenient to switch between open windows and quickly access the content or functions of different applications.
In addition to running applications, the Taskbar accommodates system icons and notifications. System icons, such as Wi-Fi, volume, battery, and the clock, provide quick access to essential system functions and status information. Notifications, including important messages or alerts, are displayed on the Taskbar to ensure that users are aware of crucial updates or events.
One of the notable features of the Taskbar is its ability to house additional toolbars. Users can customize the Taskbar by adding toolbars, such as the Quick Launch toolbar or a folder toolbar, to provide quick access to specific files, folders, or applications. This allows users to tailor the Taskbar to their needs and access important resources with ease.
The Taskbar also supports multitasking by enabling users to launch multiple instances of an application or switch between virtual desktops. Users can right-click on an application icon to open a context menu and perform actions such as opening a new instance of the application or moving the application to a different virtual desktop.
Furthermore, the Taskbar provides various customization options to suit individual preferences. Users can adjust the size of the icons on the Taskbar, choose between different Taskbar location options (such as top, bottom, left, or right), and control the visibility of specific icons or notifications.
In summary, the Taskbar in Windows is a versatile and essential component of the user interface. It allows users to navigate and manage their tasks efficiently by providing quick access to applications, system functions, and notifications. With its customization options and support for multitasking, the Taskbar enhances productivity and streamlines workflows for Windows users.
Command Prompt in Windows
The Command Prompt is a powerful command-line interpreter built into the Windows operating system. It provides users with a text-based interface to interact with the system, execute commands, and automate tasks. The Command Prompt offers a wide range of functionalities and is popular among advanced users, system administrators, and developers for its flexibility and efficiency.
Upon opening the Command Prompt, users are presented with a blank screen and a blinking cursor. This signifies that the Command Prompt is ready to accept commands. Users can type specific commands and parameters, then press Enter to execute them. The Command Prompt enables users to perform various tasks, such as launching applications, managing files and folders, configuring network settings, and more.
One of the advantages of the Command Prompt is its ability to execute powerful command-line tools and utilities. Users can leverage a variety of built-in commands, such as “dir” to list directory contents, “copy” to duplicate files, “ipconfig” to view network configurations, and “ping” to test network connectivity. Additionally, the Command Prompt supports batch scripting, allowing users to create scripts and automate repetitive tasks efficiently.
The Command Prompt offers a wide range of command-line options and parameters, allowing users to tailor the behavior of commands to their specific needs. These options can modify the output format, specify file or folder locations, enable/disable certain features, and more. By using the appropriate command-line switches, users can achieve greater control and flexibility in their command-line interactions.
Another notable feature of the Command Prompt is its support for command history. Users can utilize the up and down arrow keys to navigate through previously executed commands, making it easy to repeat or modify commands without retyping them. Command history helps enhance productivity and saves time by reducing repetitive tasks.
The Command Prompt also allows redirection of input and output, enabling users to send command results to files or receive input from files. By using various operators like “>”, “>>”, “|”, and “<", users can redirect command output to text files, append output to existing files, pipe command output to another command as input, or read input from files, respectively. This feature provides flexibility and facilitates automation and scripting.
Furthermore, the Command Prompt supports the use of environment variables, which are placeholders that represent system values or user-defined values. Users can access environment variables within commands to retrieve information or customize command behavior based on specific conditions. Environment variables enhance the flexibility and versatility of commands in the Command Prompt.
In summary, the Command Prompt in Windows is a versatile and powerful tool for interacting with the operating system through a text-based interface. With its wide range of built-in commands, support for batch scripting, command-line options, command history, and redirection capabilities, the Command Prompt offers a flexible and efficient way to perform a variety of tasks, automate processes, and customize command behavior.
Terminal in macOS and Linux
The Terminal is a command-line interface available in both macOS and Linux operating systems. It provides users with direct access to the underlying command-line environment, allowing for powerful and efficient control over the system. The Terminal is a valuable tool often preferred by developers, system administrators, and power users due to its flexibility, automation capabilities, and access to a wide range of command-line tools and utilities.
Upon opening the Terminal, users are presented with a text-based interface where they can enter commands and execute them by pressing Enter. The Terminal supports a variety of commands, allowing users to interact with the file system, manage processes, configure system settings, and perform other tasks.
The Terminal features a shell, which is a program that interprets and executes user commands. In macOS, the default shell is Bash, while Linux distributions typically have various shell options like Bash, Zsh, or Csh. Each shell offers its own set of features, customizations, and scripting abilities, allowing users to choose one that best fits their needs and preferences.
One of the benefits of the Terminal is access to a vast collection of command-line tools and utilities. Users can execute commands to perform tasks such as file navigation, text processing, system administration, package management, network troubleshooting, and more. Additionally, the Terminal allows users to install additional tools and utilities via package managers, expanding its capabilities further.
The Terminal supports scripting, which enables users to create and automate complex tasks. By writing scripts in languages like Bash, Python, or Perl, users can automate repetitive tasks, batch process files, and perform system-wide configurations. Scripting in the Terminal provides flexibility, efficiency, and the ability to customize workflows to specific requirements.
Another notable feature of the Terminal is the ability to multitask using multiplexers. Multiplexers like GNU Screen or Tmux allow users to create and manage multiple sessions within a single Terminal window. This allows for simultaneous execution of commands, easy switching between sessions, and persistent session management even after disconnecting from a remote server.
The Terminal offers powerful customization options, allowing users to modify the appearance, behavior, and key bindings according to their preferences. This includes changing color schemes, configuring shortcuts, adjusting font styles, and more. Customization options ensure a personalized and efficient work environment within the Terminal.
Furthermore, the Terminal provides easy access to system documentation and manual pages. Users can type “man” followed by a command or topic to access detailed information and documentation on specific commands or utilities. This allows users to quickly reference and understand the functionality and usage of various command-line tools.
In summary, the Terminal in macOS and Linux offers a robust command-line interface that provides direct access to the command-line environment. With its wide range of commands, scripting capabilities, package managers, customization options, and access to extensive documentation, the Terminal empowers users to work efficiently, automate tasks, and have full control over their systems by leveraging the power of the command line.