
What is the MODE function?
The MODE function is a statistical function in Google Sheets that allows you to find the most frequently occurring value or values in a range or set of data. It is commonly used for analyzing data sets and identifying the data points with the highest frequency.
When working with a large amount of data, finding the most common value manually can be time-consuming and prone to errors. However, by using the MODE function, you can quickly and accurately determine the mode of a data set, saving you valuable time and effort.
The mode is particularly useful when dealing with categorical or discrete data, such as survey responses, product preferences, or customer ratings. By identifying the most common response or preference, you can gain valuable insights into patterns, trends, and preferences within your data.
Using the MODE function, you can analyze data in multiple columns or rows, providing flexibility in your analysis. This function is especially handy for data cleaning, identifying outliers, and checking for distribution skewness.
Furthermore, the MODE function is not limited to numerical data. It can also be applied to text data, allowing you to find the most frequently occurring text values within a range.
By utilizing the MODE function, you can streamline your data analysis process, identify common trends or patterns, and make data-driven decisions based on the most frequent occurrences within your data set.
How to use the MODE function in Google Sheets
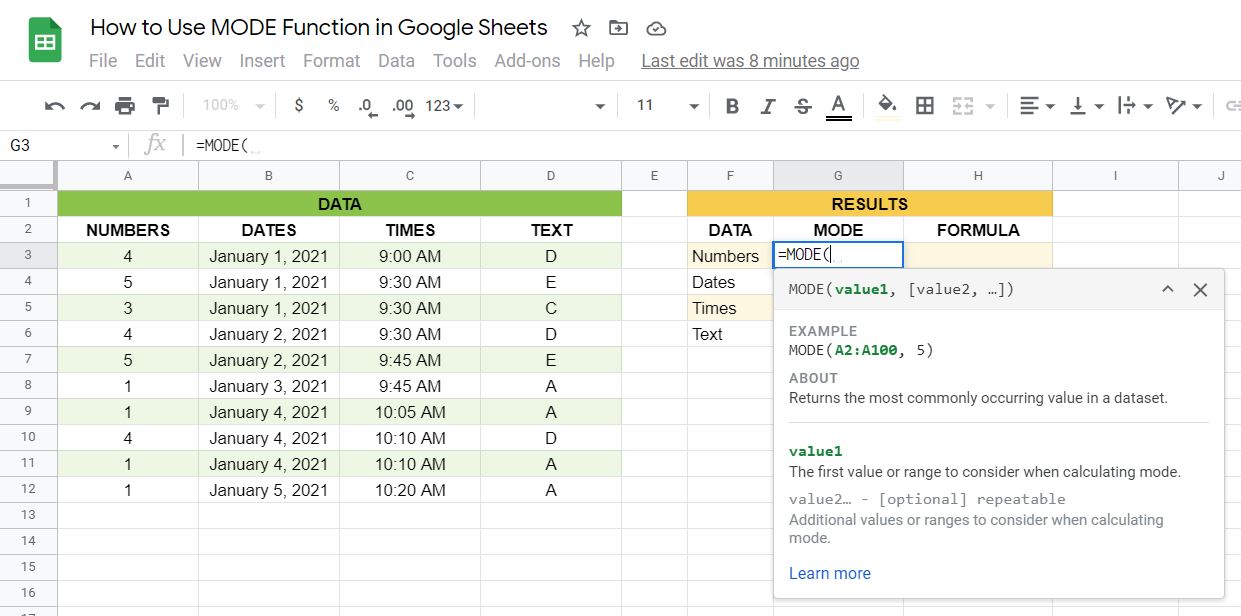
To use the MODE function in Google Sheets, follow these simple steps:
- Select the cell where you want the result of the MODE function to appear.
- Type “=” to begin a formula.
- Start typing “MODE” and you will see it appear in the auto-suggest dropdown. Press Enter or Tab to select the MODE function.
- Within the parentheses, specify the range or cells that contain the data you want to analyze. You can enter the range directly or select the cells using your mouse.
- Press Enter to apply the function. The result will be displayed in the selected cell.
It is important to note that the MODE function in Google Sheets considers all numerical values, including blank cells, zeros, and duplicates, to calculate the mode. Text values are not included in the calculation.
If there are multiple modes in your data set, Google Sheets will return the lowest value among them. In case there is no mode or all values occur with the same frequency, the function will return a #N/A error.
For more complex data sets or when dealing with multiple columns or rows, you can use the MODE function in combination with other functions and formulas. You can also apply filters to your data to narrow down the range and analyze specific subsets.
Remember to use appropriate cell references or named ranges when working with dynamic data. This ensures that your formula updates automatically when the underlying data changes.
By following these steps and understanding the ins and outs of the MODE function in Google Sheets, you can effectively analyze your data and extract valuable insights.
Syntax of the MODE function
The syntax of the MODE function in Google Sheets is as follows:
=MODE(value1, value2, ...)
The MODE function can take one or more arguments, where each argument represents a value or a range of values to be analyzed. You can enter the values directly within the parentheses, or you can refer to cells that contain the data.
The values can be numeric or text, and they can be entered as individual values or as a range of cells. You can also mix different data types within the same MODE function.
Here are a few important points to keep in mind while using the MODE function:
- Ensure that the values you provide are valid and numeric. Non-numeric values will be ignored in the mode calculation.
- If there are multiple modes in the data set, the MODE function will return the lowest mode value.
- If there is no mode or all values occur with the same frequency, the result will be a #N/A error.
It’s worth noting that the MODE function in Google Sheets does not accept wildcard characters or support partial matching. It only considers exact matches when identifying the modes.
You can also use the MODE function in combination with other functions and formulas to create more complex analysis. For example, you can use the MODE function as part of an IF function to perform conditional analysis based on the mode value.
By understanding the syntax and limitations of the MODE function, you can effectively utilize it to analyze your data and uncover key insights.
Examples of using the MODE function
Let’s explore some examples of how to use the MODE function in Google Sheets:
Example 1:
You have a sales dataset for a clothing store. In column A, you have the product names, and in column B, you have the sales quantity. To find the most commonly sold product, you can use the MODE function. Assuming the data starts from row 2, the formula would be:
=MODE(B2:B)
This will return the quantity of the most frequently sold product.
Example 2:
You conducted a survey asking customers to rate their satisfaction on a scale from 1 to 5. In column A, you have the customer names, and in column B, you have their ratings. To identify the most common satisfaction rating, you can use the MODE function. Assuming the data starts from row 2, the formula would be:
=MODE(B2:B)
This will display the most frequently occurring rating from the survey responses.
Example 3:
You have a dataset of student test scores for a math class. In column A, you have the student names, and in column B, you have their scores. To find the most common score achieved by the students, you can use the MODE function. Assuming the data starts from row 2, the formula would be:
=MODE(B2:B)
This will provide the mode value, representing the score obtained by most of the students.
These examples illustrate how the MODE function can be used to analyze different types of data and find the most frequently occurring values. By applying this function to your own datasets, you can gain valuable insights into patterns and trends within your data.
Considerations when using the MODE function
While the MODE function in Google Sheets is a powerful tool for analyzing data, there are a few considerations to keep in mind:
- Missing or non-numeric values: The MODE function includes all values, including zeros, blanks, and duplicates, in its calculation. However, non-numeric values are ignored. If you have missing data or non-numeric values in your dataset, the MODE function might not provide meaningful results.
- Multiple modes: If your data has multiple values that occur with the same maximum frequency, the MODE function will return the smallest value among them. This is important to note, as you may need to consider additional methods to identify all modes in the dataset.
- Skewed or multimodal distributions: The MODE function assumes that data follows a unimodal distribution, meaning it has a single peak or mode. If your data has a skewed or multimodal distribution, the MODE function may not accurately represent the central tendency of the data. In such cases, you may need to use other statistical measures or visualization techniques to gain a comprehensive understanding of the data distribution.
- Limited to exact matches: The MODE function in Google Sheets does not support wildcard characters or partial matching. It only considers exact matches when identifying the modes. If you want to identify modes based on partial or fuzzy matching, you may need to use other functions or methods.
- Data size limitations: As with any function in Google Sheets, there are limitations on the amount of data that can be processed. If you have a very large dataset, you may encounter performance issues or limitations when using the MODE function. In such cases, consider breaking down the data into smaller subsets or using more advanced statistical software for analysis.
By keeping these considerations in mind, you can effectively utilize the MODE function and interpret the results in the context of your dataset’s characteristics and limitations.
Other uses of the MODE function
Although the MODE function in Google Sheets is primarily used to find the most frequently occurring values in a dataset, it can also be leveraged for various other purposes:
- Data Cleaning: The MODE function can help identify outliers in your data. By comparing the mode value to other values in the dataset, you can detect potential errors or anomalies that require further investigation.
- Data Validation: In certain scenarios, you may want to ensure that a specific value or range of values occurs more often than others. By using the MODE function in combination with conditional statements, you can set up data validation rules or checks to ensure data accuracy and integrity.
- Trend Analysis: By applying the MODE function to different subsets of data, such as by month or category, you can identify trends and patterns in your data. This can be useful in various fields, such as sales forecasting, market research, and customer behavior analysis.
- Quality Control: The MODE function can be used in quality control processes to identify the most common defect or issue occurring in a manufacturing or production line. By monitoring the mode value over time, you can track the effectiveness of your quality control measures.
- Survey Analysis: When analyzing survey data, the MODE function can help you identify the most frequently selected response. This can provide valuable insights into the opinions and preferences of your survey participants.
- Performance Analysis: In sports or other competitive activities, the MODE function can be used to determine the most common score, time, or performance achievement. This can aid in assessing individual or team performance and identifying areas for improvement.
These alternate uses of the MODE function demonstrate its versatility and applicability across a wide range of industries and scenarios. By creatively applying this function to your data, you can unlock valuable insights and make data-driven decisions.