
Check CPU Temperature Using BIOS
The BIOS (Basic Input/Output System) is a firmware that is built into your computer’s motherboard. It is responsible for initializing the hardware components of your computer during startup. Most BIOS versions provide an option to check the CPU temperature, which can be accessed by entering the BIOS setup.
To check your CPU temperature using the BIOS, follow these steps:
- Restart your computer and press the BIOS key during startup. The BIOS key varies depending on the manufacturer, but common keys include F2, Del, or Esc.
- Once you enter the BIOS setup, navigate to the hardware monitoring or system health section. The exact location and labeling may vary depending on your BIOS version.
- Look for the CPU temperature or system temperature option. It may be labeled as “CPU Temp,” “System Temp,” or similar.
- The temperature will be displayed next to the option. It is usually measured in Celsius (°C).
Checking your CPU temperature using the BIOS can provide accurate and real-time readings. However, it is important to note that accessing the BIOS setup and navigating through the options might be different for each computer model and BIOS version. Refer to your computer’s documentation or the manufacturer’s website for specific instructions.
Monitoring your CPU temperature regularly can help you identify any overheating issues, which can lead to instability and hardware damage. If you notice that the CPU temperature is consistently high or exceeding safe limits, it may be necessary to take additional measures, such as improving the cooling system or cleaning the computer’s internal components.
Now that you know how to check your CPU temperature using the BIOS, you can ensure that your computer is running within safe temperature ranges, which will contribute to its overall performance and longevity.
Use CPU Temperature Monitoring Software
Another way to check your CPU temperature is by using CPU temperature monitoring software. These software programs are specifically designed to provide real-time monitoring and analysis of your computer’s temperature readings.
Here are the steps to use CPU temperature monitoring software:
- Research and choose a CPU temperature monitoring software that is compatible with your operating system. Some popular options include Core Temp, HWMonitor, SpeedFan, and Open Hardware Monitor.
- Download and install the software on your computer. Make sure to download it from a reputable source to ensure its authenticity and security.
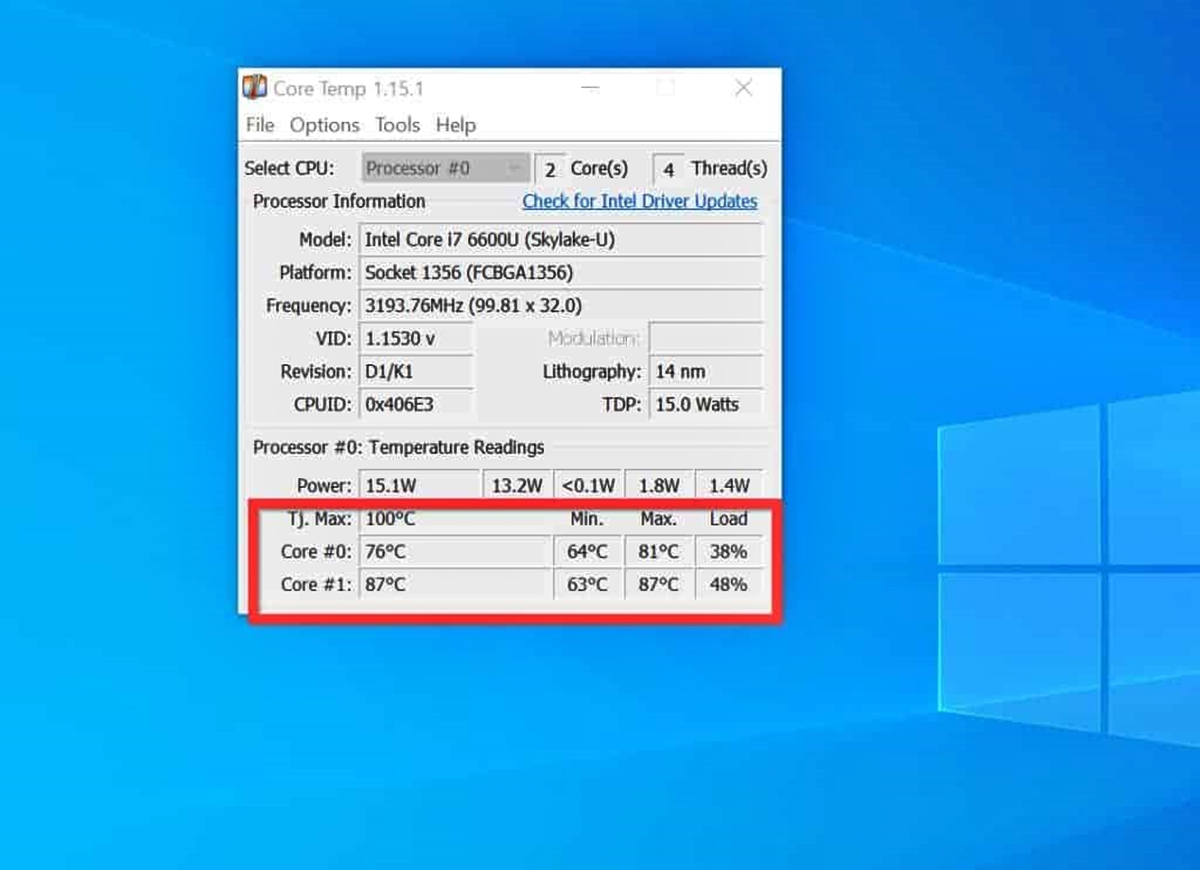
- Launch the software. The main interface will display various temperature readings, including the CPU temperature.
- Monitor the CPU temperature displayed in the software. It is typically measured in Celsius (°C) and may be accompanied by additional information such as minimum and maximum temperature values.
- Depending on the software, you may also have the option to customize temperature alerts, view temperature history graphs, and explore advanced features such as fan speed control.
Using CPU temperature monitoring software provides a convenient and user-friendly way to keep track of your CPU temperature. It allows you to view real-time temperature readings in an organized and visually appealing interface. Some software programs also offer additional features and customization options to enhance your monitoring experience.
Regularly monitoring your CPU temperature using software can help you identify any temperature spikes or overheating issues. If you notice that the CPU temperature is consistently high or reaching dangerous levels, it is essential to take appropriate steps to prevent long-term damage to your computer’s components. This may include improving the airflow inside your system, cleaning the cooling fans, or applying new thermal paste to the CPU.
Overall, using CPU temperature monitoring software is a valuable tool for ensuring the optimal performance and longevity of your computer. By keeping a close eye on your CPU temperature, you can address any potential issues proactively and maintain a cool and stable system.
Monitor CPU Temperature with Windows Resource Monitor
If you are using a Windows operating system, you can monitor your CPU temperature using the built-in Windows Resource Monitor. This tool provides an in-depth look at your computer’s performance and can also display CPU temperature readings.
Follow these steps to monitor your CPU temperature with Windows Resource Monitor:
- Open the Windows Task Manager by pressing Ctrl + Shift + Esc or right-clicking on the taskbar and selecting “Task Manager.”
- In the “Task Manager” window, click on the “Performance” tab.
- Click on the “Open Resource Monitor” link at the bottom of the window.
- In the Resource Monitor window, navigate to the “CPU” tab.
- Look for the “Temperature” column in the CPU tab, which displays the current CPU temperature.
The CPU temperature displayed in Windows Resource Monitor is measured in Celsius (°C) and is updated in real-time. It provides a convenient way to monitor your CPU temperature while performing other tasks on your computer.
Windows Resource Monitor also offers additional information such as CPU usage, memory usage, and disk activity, allowing you to have a comprehensive view of your system’s performance.
It is important to note that the availability of the “Temperature” column in Windows Resource Monitor depends on the specific CPU and motherboard being used. If you do not see the temperature information in the CPU tab, it may indicate that your hardware does not support temperature monitoring through this tool.
If you are unable to monitor your CPU temperature using Windows Resource Monitor, consider using third-party CPU temperature monitoring software or checking your BIOS settings for temperature monitoring options.
Monitoring your CPU temperature with Windows Resource Monitor can help you keep an eye on your system’s temperature while utilizing the built-in tools of Windows. This can be particularly useful for users who prefer using the native utilities provided by their operating system.
Check CPU Temperature with Task Manager
If you are using a Windows operating system, you can quickly check your CPU temperature using the built-in Task Manager. The Task Manager provides a snapshot of your system’s performance, including CPU temperature readings.
Follow these steps to check your CPU temperature with Task Manager:
- Open the Task Manager by right-clicking on the taskbar and selecting “Task Manager,” or by pressing Ctrl + Shift + Esc.
- In the Task Manager window, click on the “Performance” tab.
- Under the “Performance” tab, you will see an overview of your system’s performance metrics.
- Look for the CPU section, which displays CPU usage and other related details.
- If your system supports it, you may find the CPU temperature displayed as a reading or graph next to the CPU usage.
Please note that not all versions of Windows Task Manager display CPU temperature. In some cases, you may only see CPU usage information without temperature readings. This depends on your system configuration and hardware support.
If you are unable to find the CPU temperature in Task Manager, consider using alternative methods like BIOS temperature monitoring, third-party CPU temperature monitoring software, or other system monitoring tools.
Checking your CPU temperature with Task Manager provides a quick and convenient way to monitor your CPU’s heating levels without the need for additional software. It allows you to assess the temperature at a glance while managing your system’s resources and performance.
Monitoring CPU temperature is crucial to ensure that your computer is running within safe temperature ranges. High temperatures can lead to system instability, performance issues, and even hardware damage. If you notice that your CPU temperature is consistently high, you may need to take appropriate measures such as improving cooling, cleaning the system of dust, or considering a CPU upgrade.
By regularly checking your CPU temperature with Task Manager, you can proactively address any temperature-related concerns and maintain the optimal performance and longevity of your computer.
Use Third-Party CPU Temperature Monitoring Tools
In addition to the built-in utilities provided by your operating system, there are also several third-party CPU temperature monitoring tools available. These tools offer more advanced features and customization options to help you monitor and analyze your CPU temperature with greater detail.
Here are the steps to use third-party CPU temperature monitoring tools:
- Research and choose a reputable third-party CPU temperature monitoring tool that is compatible with your operating system. Some popular options include Core Temp, HWMonitor, SpeedFan, and Open Hardware Monitor.
- Download and install the software from the official website. Be cautious when downloading from third-party sources to ensure the authenticity and safety of the software.
- Launch the CPU temperature monitoring tool on your computer after installation.
- The tool’s interface will display the CPU temperature in real-time, along with additional information such as individual core temperatures, fan speeds, and utilization percentages.
- Explore the various features and customization options offered by the software, such as temperature alerts, logging, and graphing of temperature trends over time.
Third-party CPU temperature monitoring tools provide more comprehensive and detailed information about your CPU temperature. They offer a range of advanced features that allow you to customize the monitoring experience according to your preferences.
These tools often provide more accurate readings and can sometimes display additional information such as voltage levels, clock speeds, and power consumption, providing a comprehensive overview of your CPU’s performance.
Regularly using third-party CPU temperature monitoring tools allows you to keep a close eye on your CPU’s temperature and identify any abnormalities or potential issues. It enables you to take proactive steps to prevent overheating and ensure that your system operates within safe temperature ranges.
Bear in mind that every software tool has its own interface and set of features, so familiarize yourself with the specific tool you choose by referring to its documentation or online resources for optimal usage and understanding.
By utilizing third-party CPU temperature monitoring tools, you can gain valuable insights into your system’s temperature and ensure the stability and longevity of your CPU and overall computer performance.
Perform Stress Test to Monitor CPU Temperature
A stress test is an effective way to evaluate the performance and stability of your computer’s CPU. By subjecting your CPU to demanding tasks, you can monitor its temperature under heavy load and identify any potential overheating issues. There are various stress test tools available that can help you assess the temperature of your CPU.
Here are the steps to perform a stress test to monitor CPU temperature:
- Research and choose a reliable stress test tool that is compatible with your operating system. Some popular options include CPU-Z, Prime95, AIDA64, and IntelBurn Test.
- Download and install the stress test tool from the official website or trusted sources.
- Launch the stress test tool on your computer.
- Select the appropriate stress test settings according to your CPU and desired level of load. It is recommended to start with a moderate load and gradually increase it.
- While the stress test is running, monitor the CPU temperature using the stress test tool or a separate CPU temperature monitoring tool.
- Observe the temperature readings as the stress test progresses. Pay attention to any significant temperature increases or sustained high temperatures.
Performing a stress test allows you to simulate heavy workload conditions on your CPU and monitor how it responds in terms of temperature. This is particularly useful for gamers, content creators, and individuals who regularly engage in resource-intensive tasks.
It is important to note that stress testing generates a significant amount of heat, so ensure that your computer’s cooling system is functioning properly. Keep an eye on temperature spikes and make sure they do not exceed safe operating limits.
By performing regular stress tests, you can monitor your CPU temperature under intense workloads and identify any potential cooling issues. If you notice that your CPU temperature is consistently high or reaches unsafe levels during stress testing, it may be necessary to consider additional measures, such as improving the airflow in your system, upgrading your cooling solution, or adjusting the CPU’s clock speed and voltage settings.
Remember to regularly clean your computer’s cooling components, including fans and heat sinks, to prevent dust buildup and ensure optimal heat dissipation during stress testing and regular usage.
Performing stress tests to monitor CPU temperature provides valuable insights into your computer’s stability and temperature performance under heavy workloads. This knowledge allows you to take proactive steps to maintain a cool and efficient system.
Monitor CPU Temperature on Mac with Activity Monitor
If you are a Mac user, you can monitor your CPU temperature using the built-in Activity Monitor tool. This utility provides a comprehensive overview of your system’s performance, including CPU temperature readings.
Follow these steps to monitor your CPU temperature on a Mac using Activity Monitor:
- Open the “Finder” on your Mac and navigate to “Applications” > “Utilities” folder.
- Double-click on “Activity Monitor” to launch the tool.
- In the Activity Monitor window, click on the “CPU” tab at the top.
- Look for the “CPU Usage” section, which displays the current CPU activity and usage.
- Click on the “View” menu in the menu bar and select “Dock Icon” > “Show CPU Usage.”
- The CPU temperature is displayed as a live graph in the dock icon, giving you a quick visual representation of the temperature.
Please note that the CPU temperature monitoring feature in Activity Monitor is only available on some Mac models and operating system versions. If you do not see the temperature graph or readings, it may indicate that your Mac does not support temperature monitoring through this tool.
If you are unable to monitor your CPU temperature using Activity Monitor or want more detailed information, consider using third-party CPU temperature monitoring software specifically designed for Mac systems.
Regularly monitoring your CPU temperature using Activity Monitor or other tools is essential to ensure that your Mac is operating within safe temperature ranges. Excessively high temperatures can lead to performance issues, system crashes, and even hardware damage.
By keeping a close eye on your CPU temperature, you can identify any abnormalities or potential issues and take appropriate measures to prevent overheating. These measures may include cleaning dust from your Mac’s cooling system, adjusting fan speeds, or optimizing your workflow to minimize CPU-intensive activities.
Activity Monitor provides a convenient and built-in solution for Mac users to monitor CPU temperature. By utilizing this tool, you can maintain the optimal performance and longevity of your Mac while safeguarding against potential overheating problems.
Monitor CPU Temperature on Linux
Monitoring your CPU temperature on Linux is essential to ensure optimal performance and prevent overheating. Linux offers various built-in tools and third-party applications that allow you to check the temperature of your CPU.
Here are some methods to monitor CPU temperature on Linux:
- Lm-sensors: Lm-sensors is a command-line tool that provides detailed hardware information, including CPU temperature. Install lm-sensors by using the package manager specific to your Linux distribution (e.g., apt-get for Ubuntu, yum for CentOS). Once installed, run the command “sensors” or “sensors-detect” to detect and display CPU temperature readings.
- Psensor: Psensor is a graphical tool that displays temperature readings and other hardware information. Install psensor using your Linux distribution’s package manager. Once installed, launch Psensor, and it will provide real-time CPU temperature readings in a user-friendly graphical interface.
- Conky: Conky is a highly customizable system monitor for Linux that allows you to display various system information, including CPU temperature, on your desktop. Install Conky using your package manager, then configure it to display CPU temperature by editing the Conky configuration file.
- GNOME System Monitor: If you are using a Linux distribution with GNOME desktop environment, you can use the GNOME System Monitor to monitor CPU temperature. Launch the System Monitor, navigate to the Resources tab, and the CPU temperature will be displayed.
- Hardware-specific tools: Some CPU manufacturers provide proprietary tools for monitoring CPU temperature on Linux. For example, AMD offers Ryzen Master for their Ryzen processors, and Intel provides Intel Power Gadget for their CPUs. Check your CPU manufacturer’s website for any specific tools available.
Regularly monitoring your CPU temperature on Linux helps you identify any potential overheating issues and take necessary measures to maintain a stable and cool system. If you notice consistently high temperatures, consider improving your system’s cooling by cleaning dust from fans and heat sinks, applying new thermal paste, or configuring custom fan profiles.
Remember that the availability and accuracy of CPU temperature readings may vary depending on your hardware and software configurations. It is advisable to use multiple tools and cross-reference the readings for a more accurate assessment of your CPU temperature.
By utilizing the available tools and applications, you can effectively monitor your CPU temperature on Linux, ensuring optimal performance and the longevity of your system.