
What is a GROUP BY Query?
A GROUP BY query is a powerful feature in Microsoft Access that allows you to group and organize data based on one or more specified columns. It is used to aggregate and summarize data in a way that provides meaningful insights and analysis. When you execute a GROUP BY query, the database groups the rows based on the selected column(s) and applies aggregate functions to calculate summary information for each group.
This type of query is especially useful when you need to answer questions such as:
- “What is the total sales per region?”
- “How many orders were placed by each customer?”
- “What is the average salary by department?”
By grouping the data, you can easily identify patterns, trends, and anomalies. It allows you to gain a deeper understanding of your data by providing a consolidated view of information based on common attributes.
Furthermore, a GROUP BY query can be used to calculate various aggregate functions such as SUM, COUNT, AVG, MIN, MAX, and more. These functions help you perform mathematical calculations on data within each group, giving you valuable insights into the summarized information.
For example, let’s say you have a sales database with a table that contains information about customers, products, and sales amounts. With a GROUP BY query, you can determine the total sales amount for each product category, or even the average sales amount per customer.
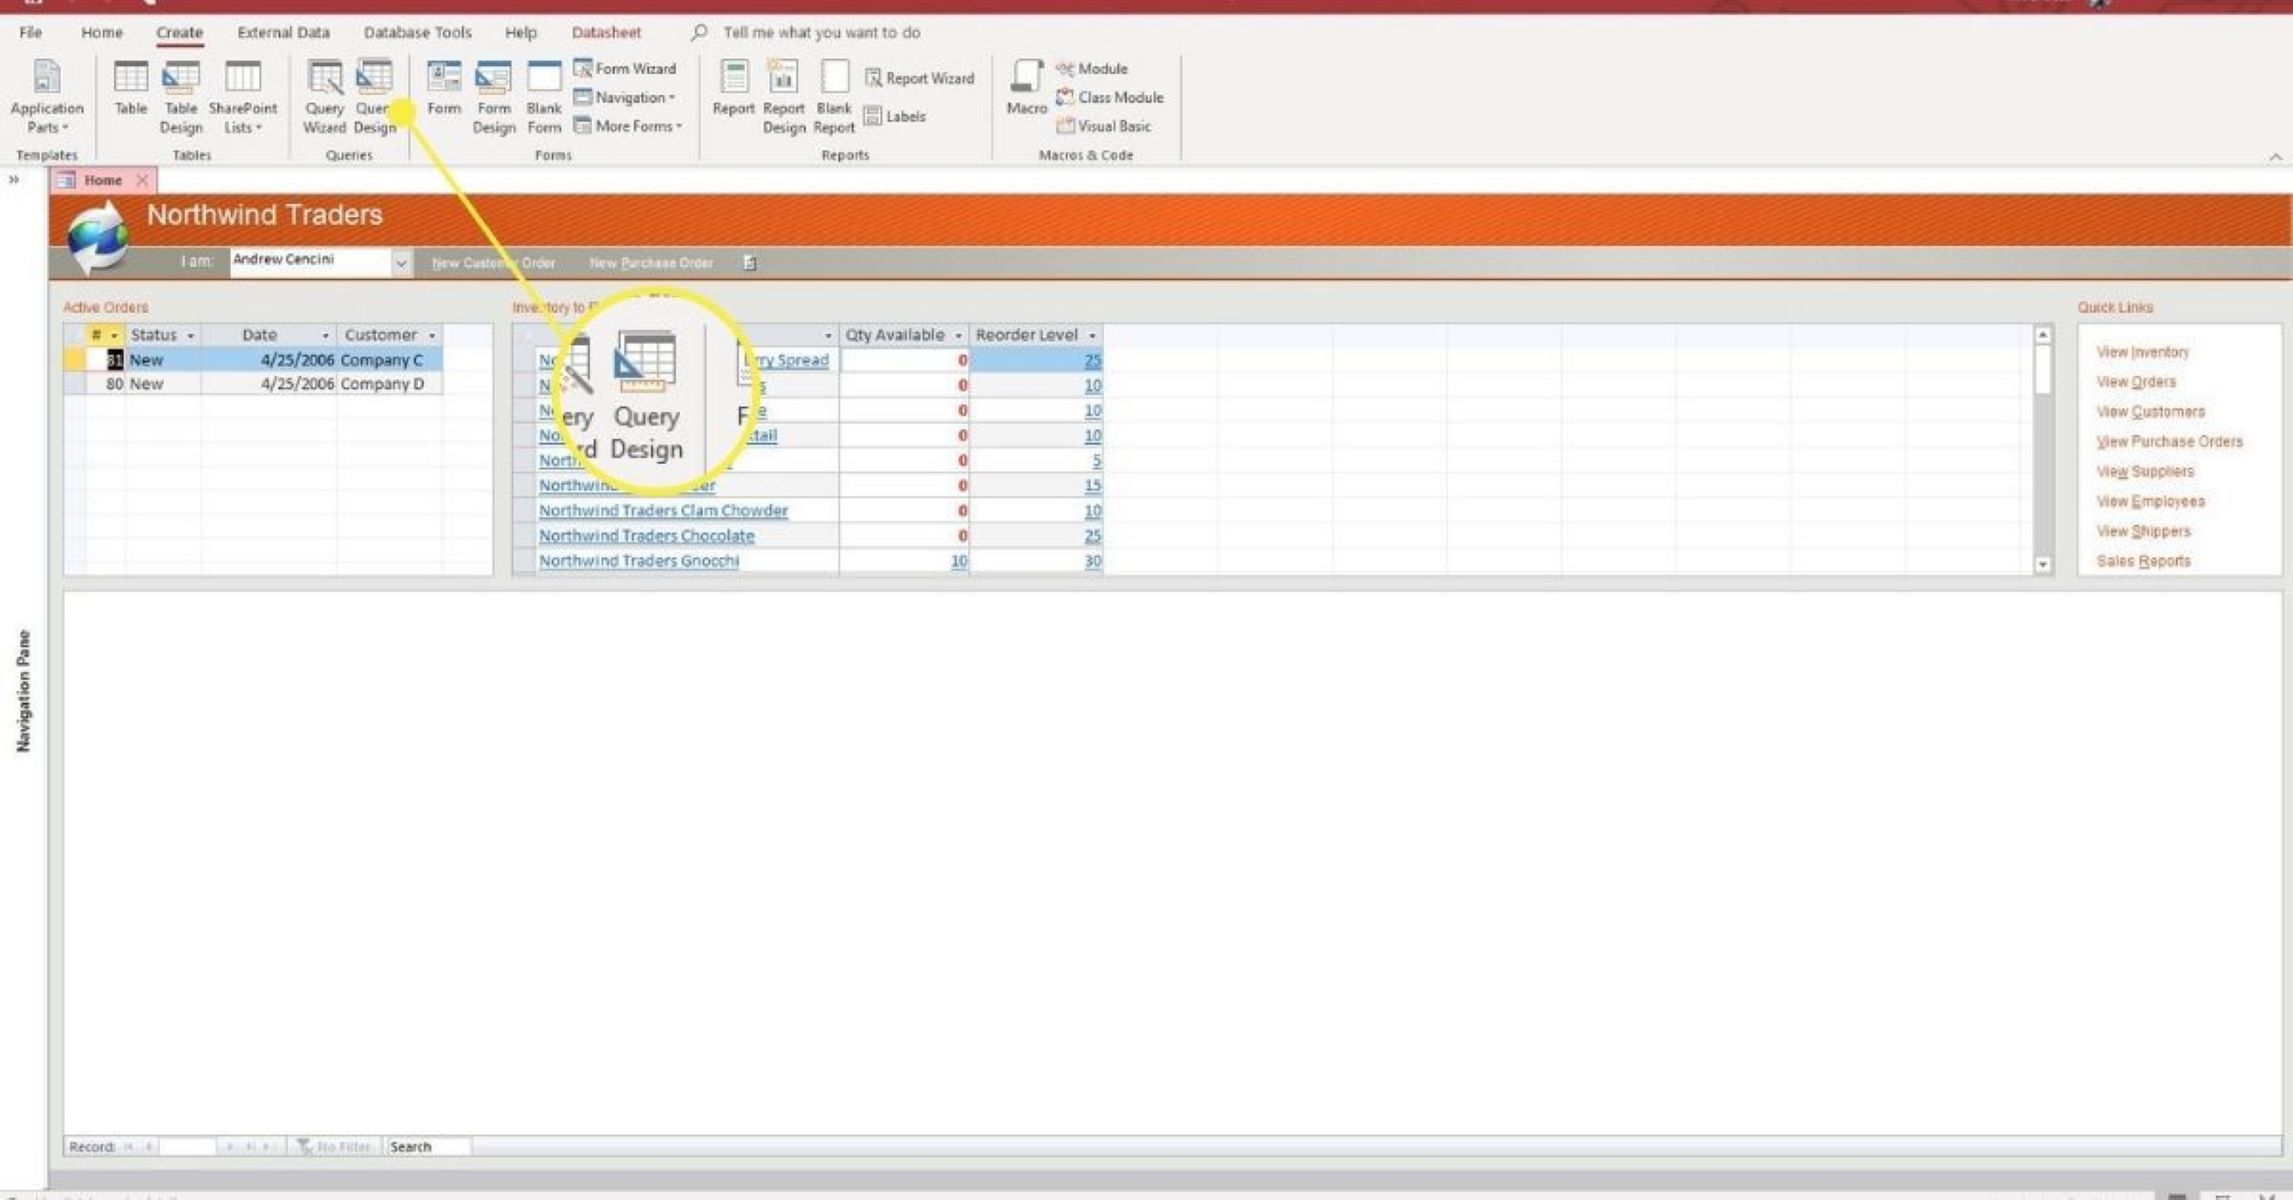
How to Use GROUP BY in a Query
Using the GROUP BY clause in a query is straightforward and can be done by following these steps:
- Start by creating a new query in Microsoft Access.
- Select the table or tables that contain the data you want to group.
- Add the desired columns to the query grid. These columns will serve as the grouping criteria.
- Add any additional columns that you want to include in the query’s output.
- Click on the “Design” tab and locate the “Group By” button in the “Query Type” group.
- Click on the “Group By” button to apply the grouping to the selected columns.
- Optionally, specify any aggregate functions you want to use to calculate summary information for each group.
- Run the query to see the grouped data and the calculated results.
Once the query is executed, the results will be displayed, showing the grouped data based on the specified columns. Each group will have its own set of summarized information based on the selected aggregate functions.
It’s important to note that when using the GROUP BY clause in a query, you may need to use aggregate functions for all non-grouped columns. This is because the query needs to know how to summarize the data for each group. If you include a column in the query that is not part of the grouping criteria or an aggregate function, you will receive an error.
The order in which columns are added to the GROUP BY clause determines the hierarchy of the grouping. The query will first group the data based on the first column, and then further group it based on the subsequent columns. This allows you to create more complex groupings and analyze the data at different levels of granularity.
Using GROUP BY with Aggregate Functions
One of the main advantages of using the GROUP BY clause in a query is the ability to use aggregate functions to calculate summary information for each group. Aggregate functions perform calculations on a set of values within a group and return a single result.
Here are some commonly used aggregate functions that can be used with the GROUP BY clause:
- SUM: Calculates the sum of a numeric column within each group.
- COUNT: Counts the number of rows within each group.
- AVG: Calculates the average of a numeric column within each group.
- MIN: Retrieves the minimum value of a column within each group.
- MAX: Retrieves the maximum value of a column within each group.
For example, let’s say we have a table called “Orders” with columns such as “CustomerID”, “ProductID”, and “Quantity”. We can use the GROUP BY clause along with the SUM function to calculate the total quantity of products ordered by each customer:
sql
SELECT CustomerID, SUM(Quantity) AS TotalQuantity
FROM Orders
GROUP BY CustomerID;
This query will group the data by the “CustomerID” column and calculate the total quantity of products ordered by each customer. The result will include the customer ID and the corresponding total quantity.
In addition to the aggregate functions mentioned above, you can also use other functions like COUNT(DISTINCT) to count the number of distinct values within each group, or even create your own custom aggregate functions using VBA (Visual Basic for Applications).
Using aggregate functions with GROUP BY allows you to extract meaningful insights and perform calculations on specific subsets of data. It provides a powerful way to analyze and summarize your data at a higher level.
Grouping Data by Multiple Columns
In Microsoft Access, you can group data not only by a single column but also by multiple columns. Grouping data by multiple columns allows for more detailed and specific analysis, as it provides a hierarchical structure to the grouped results.
To group data by multiple columns, you need to include the desired columns in the GROUP BY clause of your query. The order of the columns within the GROUP BY clause determines the hierarchy of the grouping.
For example, let’s consider a table called “Sales” with columns like “Region”, “ProductCategory”, and “Year”. To group the data by both region and product category, with further separation by year, you can use the following query:
sql
SELECT Region, ProductCategory, Year, SUM(SalesAmount) AS TotalSales
FROM Sales
GROUP BY Region, ProductCategory, Year;
This query will group the data first by region, then by product category, and finally by year. It calculates the total sales amount for each combination of region, product category, and year.
By grouping data in this manner, you can gain insights into how sales vary across different regions, product categories, and years. You can identify top-performing regions, popular product categories, and trends over time. This hierarchical grouping allows for a more comprehensive and nuanced analysis of your data.
It’s important to note that the number of columns you group by can affect the level of detail in your results. Grouping by more columns creates smaller, more specific groups, while grouping by fewer columns creates larger, more generalized groups.
When grouping data by multiple columns, always consider the relationships and interactions between the columns. Analyzing data at different levels of granularity can lead to valuable insights and help you make informed decisions.
Filtering Grouped Data with HAVING Clause
In Microsoft Access, after grouping data using the GROUP BY clause, you can further filter the grouped results by using the HAVING clause. The HAVING clause allows you to apply conditions to the grouped data, similar to how the WHERE clause is used to filter individual rows.
While the WHERE clause filters rows before the data is grouped, the HAVING clause filters the grouped data based on the results of the aggregate functions applied. This means that you can use the HAVING clause to specify conditions that are based on the calculated summaries of each group.
To use the HAVING clause, you need to include it after the GROUP BY clause in your query. The condition specified in the HAVING clause determines which groups are included in the final result set.
For example, let’s consider a table called “EmployeeSales” with columns like “EmployeeID” and “TotalSales”. We want to find the employee(s) who have achieved a total sales amount higher than $10,000. We can use the following query:
sql
SELECT EmployeeID, SUM(TotalSales) AS TotalSales
FROM EmployeeSales
GROUP BY EmployeeID
HAVING SUM(TotalSales) > 10000;
This query will group the data by employee ID and calculate the total sales amount for each employee. The HAVING clause will then filter the results and include only the groups where the total sales amount is greater than $10,000.
The HAVING clause allows for more advanced filtering of grouped data based on aggregate calculations. You can use various comparison operators such as > (greater than), < (less than), = (equal to), and more to specify the conditions for filtering.
By using the HAVING clause, you can segment and analyze grouped data based on specific criteria. It helps you focus on subsets of data that meet certain conditions, allowing for more precise and targeted analysis.
Sorting Grouped Data with ORDER BY Clause
In Microsoft Access, the ORDER BY clause is used to sort the results of a query. When working with grouped data, you can use the ORDER BY clause to sort the groups based on one or more columns. This allows you to control the order in which the grouped data is displayed.
The ORDER BY clause is included at the end of your query, after the GROUP BY and HAVING clauses, if present. It specifies the column(s) by which you want to sort the grouped data and the sort order, which can be either ascending (ASC) or descending (DESC).
For example, let’s consider a table called “Employees” with columns like “Department” and “AverageSalary”. We want to display the departments in descending order of their average salary. We can use the following query:
sql
SELECT Department, AVG(Salary) AS AverageSalary
FROM Employees
GROUP BY Department
ORDER BY AverageSalary DESC;
This query will group the data by department and calculate the average salary for each department. The ORDER BY clause will sort the departments in descending order based on their average salary.
You can also sort the grouped data by multiple columns. For example, let’s say we have a table called “Sales” with columns like “Region”, “ProductCategory”, and “TotalSales”. We want to display the sales data grouped by both region and product category, sorted first by region in ascending order, and then by product category in descending order. We can use the following query:
sql
SELECT Region, ProductCategory, SUM(TotalSales) AS TotalSales
FROM Sales
GROUP BY Region, ProductCategory
ORDER BY Region ASC, ProductCategory DESC;
This query will group the data by region and product category, calculating the total sales for each combination. The ORDER BY clause will sort the groups first by region in ascending order and within each region, it will sort the product categories in descending order. This allows for a customized and specific order of the grouped data.
Sorting grouped data with the ORDER BY clause provides flexibility in how the results are presented. It allows you to arrange the groups in a logical and meaningful order, making it easier to analyze and interpret the data.
Grouping Data by Date or Time
In Microsoft Access, you can easily group data based on dates or times to gain insights into patterns, trends, and summaries over specific intervals. Whether you are working with sales data, project deadlines, or event schedules, grouping data by date or time allows you to analyze information based on specific time periods.
To group data by date or time, you need to extract the relevant information from your date or time column and use it as a grouping criterion in your query.
For example, let’s say you have a table called “Sales” with a column named “OrderDate”, and you want to group the sales data by month. You can use the MONTH() function to extract the month from the “OrderDate” column and group the data accordingly:
sql
SELECT MONTH(OrderDate) AS Month, SUM(SalesAmount) AS TotalSales
FROM Sales
GROUP BY MONTH(OrderDate);
This query will group the sales data by month, using the MONTH() function to extract the month from the “OrderDate” column. The result will show the total sales amount for each month.
You can apply the same concept to group data by other time intervals, such as day, year, hour, or minute. Depending on your specific needs, you can use appropriate functions like DAY(), YEAR(), HOUR(), or MINUTE() to extract the corresponding values.
Grouping data by date or time allows you to identify trends, seasonality, or patterns based on specific time periods. You can easily determine sales performance by month, compare the productivity of different days, or analyze the distribution of events over hours.
By utilizing the built-in date and time functions in your queries, you can gain valuable insights and make data-driven decisions based on temporal analysis.
Grouping Data by a Calculated Field
In Microsoft Access, you can group data not only by existing fields in a table but also by a calculated field. A calculated field allows you to perform calculations on existing fields to create a new field, which can then be used for grouping purposes.
To group data by a calculated field, you need to create the calculation in your query and give it an alias. You can then include the alias in the GROUP BY clause to group the data accordingly.
For example, let’s say you have a table called “Employees” with columns like “FirstName”, “LastName”, and “Salary”. If you want to group the employees based on their salary ranges, you can create a calculated field that assigns each employee to a range and use it for grouping. Here’s an example:
sql
SELECT Salary,
IIF(Salary < 30000, 'Low',
IIF(Salary >= 30000 AND Salary < 60000, 'Medium', 'High')
) AS SalaryRange,
COUNT(*) AS EmployeeCount
FROM Employees
GROUP BY SalaryRange;
In this query, the calculated field “SalaryRange” is created using the IIF() function and assigns each employee to a salary range: “Low”, “Medium”, or “High”. The GROUP BY clause then groups the data based on the salary range, allowing you to see the number of employees in each range.
By grouping data based on a calculated field, you can gain insights into specific categories or groups that are not directly represented in the original data. This approach allows for a more customized and granular analysis, as you can tailor the grouping to suit your specific needs.
Calculated fields can include various calculations involving mathematical functions, logical operators, string manipulation, and more. Leveraging these calculations in your queries empowers you to derive meaningful insights by grouping data based on customized criteria.
Grouping Data by Text Fields
In Microsoft Access, you can group data based on text fields to analyze and summarize information based on specific categories or attributes. Grouping data by text fields allows you to gain insights into patterns, frequencies, and distributions within the textual data.
To group data by text fields, you simply include the text field in the GROUP BY clause of your query. Access will then group the data based on the distinct values in the text field.
For example, let’s say you have a table called “Products” with a column named “Category”, and you want to group the products by category. You can use the following query:
sql
SELECT Category, COUNT(*) AS ProductCount
FROM Products
GROUP BY Category;
This query will group the products by their respective categories and calculate the count of products within each category. The result will provide you with the category names and the corresponding counts.
Grouping data by text fields can be particularly useful when working with categorical data, such as types of products, customer segments, or project statuses. It allows you to identify the distribution of data across different categories and gain insights into the prominence or popularity of specific categories.
Additionally, you can use aggregate functions like COUNT, SUM, AVG, etc., within the SELECT statement to perform calculations on text fields. This allows you to analyze specific metrics or characteristics associated with each category.
By grouping data based on text fields, you can uncover patterns, trends, and relationships within your data. It enables you to segment and analyze your data in a meaningful and informative way, helping you make data-driven decisions based on categorical information.
Grouping Data by Number Fields
In Microsoft Access, you can group data based on number fields to analyze and summarize information based on numerical values. Grouping data by number fields allows you to gain insights into patterns, trends, and distributions within the numeric data.
To group data by number fields, you simply include the number field in the GROUP BY clause of your query. Access will then group the data based on the distinct values in the number field.
For example, let’s say you have a table called “Employees” with a column named “Age”, and you want to group the employees by age range. You can use the following query:
sql
SELECT Age, COUNT(*) AS EmployeeCount
FROM Employees
GROUP BY Age;
This query will group the employees by their respective ages and calculate the count of employees within each age group. The result will provide you with the age values and the corresponding counts.
Grouping data by number fields allows you to identify the distribution of data across different numeric ranges and gain insights into their frequencies and densities. This can be particularly useful when analyzing data such as revenue ranges, salary bands, product prices, or any other numeric attribute.
Additionally, you can use aggregate functions like COUNT, SUM, AVG, etc., within the SELECT statement to perform calculations on number fields. This enables you to analyze specific metrics or characteristics associated with each numeric group.
By grouping data based on number fields, you can uncover patterns, trends, and relationships within your numeric data. It allows you to segment and analyze your data in a meaningful and informative way, helping you make data-driven decisions based on numerical information.
Grouping Data by Yes/No Fields
In Microsoft Access, you can group data based on Yes/No fields to analyze and summarize information based on binary values. Grouping data by Yes/No fields allows you to gain insights into the distribution and frequency of positive or negative outcomes within your dataset.
To group data by Yes/No fields, you simply include the Yes/No field in the GROUP BY clause of your query. Access will then group the data based on the distinct values in the Yes/No field.
For example, let’s say you have a table called “SurveyResponses” with a column named “Satisfied”, which indicates whether a customer was satisfied with a product or service (Yes or No). You can use the following query to group the responses by satisfaction:
sql
SELECT Satisfied, COUNT(*) AS ResponseCount
FROM SurveyResponses
GROUP BY Satisfied;
This query will group the responses by their respective satisfaction levels (Yes or No) and calculate the count of responses within each category. The result will provide you with the satisfaction levels and the corresponding counts.
Grouping data by Yes/No fields can be particularly useful when analyzing survey data, customer feedback, or any binary-based attribute. It allows you to understand the distribution of positive and negative outcomes or opinions within your dataset.
In addition to counting the occurrences of Yes and No, you can also use aggregate functions like SUM or AVG on other numeric fields based on the Yes/No grouping. This enables further analysis and calculation of metrics associated with the positive or negative outcomes.
By grouping data based on Yes/No fields, you can uncover patterns and insights related to the presence or absence of certain characteristics or outcomes. It enables you to segment and analyze your data in a meaningful way, helping you make data-driven decisions based on binary information.
Grouping Data by Lookup Fields
In Microsoft Access, lookup fields allow you to reference values from another table, providing a way to categorize and classify data based on predefined options. You can use lookup fields to group and analyze data by their corresponding lookup values, providing meaningful insights into the distribution and frequency of different categories.
To group data by lookup fields, you need to include the lookup field in the GROUP BY clause of your query. Access will then group the data based on the distinct values in the lookup field.
For example, let’s say you have a table called “Customers” with a lookup field named “Country” that references a table containing various countries. You can use the following query to group the customers by country:
sql
SELECT Country, COUNT(*) AS CustomerCount
FROM Customers
GROUP BY Country;
This query will group the customers by their respective countries and calculate the count of customers within each country. The result will provide you with the country names and the corresponding counts.
Grouping data by lookup fields allows you to analyze the distribution of data based on predefined categories or options. This can be particularly useful when working with tables that contain reference values like product categories, geographical regions, or customer types.
Lookup fields also offer the benefit of enforcing data integrity by allowing you to select values from a predefined list. By grouping data based on these lookup fields, you can gain insights into the distribution and frequency of options within your dataset.
In addition to the COUNT function, you can also use other aggregate functions like SUM or AVG on numeric fields associated with the lookup values, providing further analysis and metrics based on the grouped data.
By grouping data based on lookup fields, you can easily categorize and analyze your data, extracting valuable insights and making data-driven decisions based on the predefined options provided by the lookup field.
Grouping Data in a Subquery
In Microsoft Access, you have the flexibility to group data within a subquery, allowing you to perform more complex and advanced analysis. Grouping data in a subquery involves creating a nested query inside the main query, which helps to organize and structure the data for a more comprehensive analysis.
By grouping data in a subquery, you can perform calculations or apply conditions on the grouped data before incorporating it into the main query. This allows you to manipulate the data at a granular level before retrieving the final results.
For example, let’s say you have two tables, “Orders” and “Customers”. You want to retrieve the total number of orders for each customer but only for those customers who have made more than five orders. You can use a subquery to achieve this:
sql
SELECT CustomerID, OrderCount
FROM (
SELECT CustomerID, COUNT(*) AS OrderCount
FROM Orders
GROUP BY CustomerID
HAVING COUNT(*) > 5
) AS Subquery;
In this query, the subquery is enclosed within parentheses and given an alias of “Subquery”. It groups the orders by customer ID and calculates the number of orders for each customer. The HAVING clause is used to filter the groups based on the condition that the order count should be greater than five. The outer query then selects the customer ID and order count from the subquery, providing the final result.
Grouping data within a subquery enables you to manipulate and filter the data before integrating it into the main query. It offers flexibility in performing calculations, applying conditions, or even joining tables within the subquery, allowing for a more dynamic and customizable analysis.
By utilizing subqueries to group data, you can retrieve specific subsets of data and perform targeted analysis while maintaining the overall structure and coherence of your queries.
Grouping Data in a Union Query
In Microsoft Access, you can group data in a Union query to combine the results of multiple queries into a single result set. A Union query allows you to merge the data from different tables or queries and group it together based on common attributes, providing a consolidated view of the data.
When grouping data in a Union query, you need to ensure that the individual queries within the Union query have the same number of columns and corresponding data types. This allows the Union query to combine the data properly and perform the desired grouping.
For example, let’s say you have two tables, “Employees” and “Customers”, and you want to create a Union query to retrieve the total count of employees and customers by city. You can use the following Union query:
sql
SELECT City, COUNT(*) AS TotalCount
FROM Employees
GROUP BY City
UNION
SELECT City, COUNT(*) AS TotalCount
FROM Customers
GROUP BY City;
In this Union query, the first SELECT statement retrieves the total count of employees grouped by city, and the second SELECT statement retrieves the total count of customers grouped by city. The UNION operator combines the results of both queries into a single result set, merging the data and grouping it by city.
Grouping data in a Union query allows you to consolidate information from different sources and perform analysis on the combined dataset. It enables you to gather insights and statistics based on common attributes across multiple tables or queries.
Additionally, you can use aggregate functions like SUM, AVG, or MAX within the individual SELECT statements of the Union query to perform calculations on the grouped data, further enhancing your analysis.
By grouping data in a Union query, you can create a unified view of information from diverse sources, facilitating comprehensive analysis and decision-making based on the combined dataset.
Tips and Tricks for Using GROUP BY Queries
When working with GROUP BY queries in Microsoft Access, there are several tips and tricks that can help you optimize your queries and extract valuable insights from your data:
- Choose appropriate aggregate functions: Depending on the type of data you are analyzing, select the relevant aggregate functions like SUM, COUNT, AVG, MIN, or MAX to perform calculations on the grouped data. This will ensure accurate and meaningful results.
- Consider the order of columns in the GROUP BY clause: The order in which columns are listed in the GROUP BY clause determines the hierarchy of the grouping. Arrange them in a logical manner to achieve the desired level of granularity in your results.
- Filter grouped data with the HAVING clause: Use the HAVING clause to apply conditions on the grouped data based on the aggregate functions. This allows you to further filter and refine the results to focus on specific subsets of data.
- Sort grouped data with the ORDER BY clause: Use the ORDER BY clause to specify the sorting order for the grouped data. This helps organize and present the results in a meaningful way, allowing for easier interpretation of the data.
- Be mindful of NULL values: When using GROUP BY queries, be aware that NULL values may affect your results. Consider handling or excluding NULL values as needed to prevent any unexpected behavior or discrepancies.
- Understand the impact of grouping: Grouping data alters the structure and format of the output. Be mindful of the implications it may have on subsequent calculations or analyses, and ensure that the grouping aligns with your intended goals.
- Use subqueries or union queries for complex grouping: When dealing with complex scenarios or the need for more advanced calculations, consider using subqueries or union queries to group data within nested queries, allowing for more flexibility and control over the grouping process.
- Validate your results: Always verify the output of your GROUP BY queries to ensure that the grouping and calculations accurately reflect your data. Cross-reference with known values or perform additional checks to confirm the validity of the results.
By applying these tips and tricks, you can enhance the effectiveness and efficiency of your GROUP BY queries, enabling you to gain meaningful insights and make informed decisions based on the analysis of your data.