
What is the STDEV Function?
The STDEV function is a powerful statistical function in Excel that calculates the standard deviation of a given set of numbers. Standard deviation is a measure of how spread out the values in a dataset are from the mean (average). It helps to analyze the variability or dispersion of data and provides valuable insights in fields such as finance, research, and data analysis.
The STDEV function uses a predetermined formula to calculate the standard deviation. It takes into account the entire dataset or a specified range of values and returns the standard deviation as the output.
The standard deviation is a useful metric because it quantifies the degree of variation or uncertainty within a dataset. A low standard deviation indicates that the values in the dataset are close to the mean, while a high standard deviation suggests that the values are more dispersed or scattered.
By using the STDEV function, you can easily determine the spread of values in a dataset. This information is valuable in many scenarios, such as identifying outliers, measuring the performance of investments, assessing the consistency of data, and making informed decisions based on the variability of data.
Excel provides different variations of the STDEV function, such as STDEV.S, STDEV.P, STDEVA, STDEVPA, and STDEVP, each with slight differences in their calculations. These variations allow users to tailor the function to their specific needs.
Now that you understand what the STDEV function is, let’s explore the syntax and usage of this function in more detail.
Syntax of the STDEV Function
The syntax of the STDEV function in Excel is relatively straightforward. It follows a predefined pattern that requires specific arguments to be passed in order to perform the standard deviation calculation.
The general syntax of the STDEV function is as follows:
- =STDEV(number1, [number2], [number3], …)
The number1, number2, and number3 parameters represent the values or range of cells for which you want to calculate the standard deviation. You can include up to 255 numbers or ranges as arguments.
It is important to note that the values or ranges enclosed within the parentheses should be separated by commas.
Here’s an example of the STDEV function in action:
- =STDEV(A1:A10)
This formula calculates the standard deviation for the range of cells from A1 to A10.
It is essential to ensure that the values entered as arguments are valid numbers. Any non-numeric values, such as text or empty cells, will be disregarded by the function during the calculation.
Furthermore, it is important to use proper referencing while specifying ranges of cells. By using absolute or relative cell references, you can ensure that the function adjusts its calculation accordingly when copied or filled to other cells.
Now that you are familiar with the syntax of the STDEV function, let’s move on and explore how to use this function with a range of cells in Excel.
Using the STDEV Function with a Range of Cells
The STDEV function in Excel is commonly used to calculate the standard deviation of a range of cells. This allows you to determine the variability or spread of a dataset based on the values within that range.
To use the STDEV function with a range of cells, follow these steps:
- Select the cell where you want the result to be displayed.
- Type =STDEV( to start the function.
- Select the range of cells for which you want to calculate the standard deviation.
- Close the function by typing ) and press Enter.
Here’s an example to illustrate the process:
- Assume you have a dataset in cells A1 to A10 that contains the values you want to analyze.
- Select a different cell, for example, B1, where you want the standard deviation result to appear.
- Type =STDEV(A1:A10) in cell B1.
- Press Enter to obtain the standard deviation value.
The result will be displayed in cell B1, indicating the standard deviation of the values in the specified range.
It is essential to ensure that the range you select contains only numeric values. Non-numeric values, such as text or empty cells, will be excluded from the calculation.
Moreover, when working with large datasets, it is best practice to use named ranges. By assigning a name to the range of cells, you can make your formulas more readable and easier to manage.
Now that you know how to use the STDEV function with a range of cells, let’s explore how to use the function with individual values.
Using the STDEV Function with Individual Values
The STDEV function in Excel not only allows you to calculate the standard deviation of a range of cells but also works with individual values. This flexibility enables you to analyze the variability or dispersion of data points even if they are not contained within a contiguous range.
To use the STDEV function with individual values, follow these steps:
- Select the cell where you want the result to be displayed.
- Type =STDEV( to start the function.
- Enter the individual values that you want to include in the standard deviation calculation, separating them with commas.
- Close the function by typing ) and press Enter.
Here’s an example to illustrate the process:
- Assume you want to calculate the standard deviation of the values 10, 15, 20, and 25.
- Select a cell, for example, B1, where you want the standard deviation result to appear.
- Type =STDEV(10, 15, 20, 25) in cell B1.
- Press Enter to obtain the standard deviation value.
After pressing Enter, the standard deviation of the provided values will be displayed in cell B1.
When using the STDEV function with individual values, it is important to ensure that you enter valid numeric values. Non-numeric values or empty cells will be ignored by the function during the calculation.
This feature of the STDEV function offers great flexibility in analyzing and comparing isolated data points without the constraint of being within a range.
Now that you understand how to use the STDEV function with individual values, let’s explore how to ignore blank cells or text values when using the STDEV function.
Ignoring Blank Cells or Text Values when Using the STDEV Function
When using the STDEV function in Excel, you may encounter situations where your dataset contains blank cells or text values. These non-numeric entries can affect the accuracy of the standard deviation calculation. Fortunately, there are ways to handle these scenarios and ensure that the STDEV function ignores these unwanted values.
To ignore blank cells or text values when using the STDEV function, you can utilize the IF and ISNUMBER functions in combination. Here’s how:
- Select the cell where you want the result to be displayed.
- Type =STDEV(IF(ISNUMBER(A1:A10),A1:A10)) to start the formula.
- Press Ctrl + Shift + Enter to enter the formula as an array formula.
This formula checks each value in the range A1:A10 using the ISNUMBER function. If a value is a number, it is included in the STDEV calculation. If a value is a blank cell or text, it is excluded from the calculation.
It is important to enter the formula as an array formula by pressing Ctrl + Shift + Enter. This tells Excel to treat the formula as an array and perform the calculation on each element individually.
By using this approach, you can ensure that blank cells or text values do not interfere with the calculation of the standard deviation. Only numeric values within the range will be considered.
Handling blank cells or text values in this manner allows for more accurate statistical analysis when using the STDEV function. It enables you to focus solely on the relevant data points within your dataset.
Now that you know how to handle blank cells or text values, let’s discuss the variations of the STDEV function available in Excel.
Using the STDEV.S Function
In addition to the standard STDEV function, Excel provides variations of the standard deviation calculation to meet different requirements. One of these variations is the STDEV.S function. The STDEV.S function is used to calculate the standard deviation of a sample from a population.
The syntax of the STDEV.S function is similar to the standard STDEV function:
- =STDEV.S(number1, [number2], [number3], …)
Just like the standard deviation function, the STDEV.S function requires numeric values or ranges for its arguments. It can accept up to 255 numbers or ranges as inputs.
The STDEV.S function uses a slightly different formula compared to the standard STDEV function to calculate the sample standard deviation. It divides the sum of the squared differences between each value and the sample mean by (n-1), where n represents the sample size.
Here’s an example to demonstrate the usage of the STDEV.S function:
- Assume you have a sample dataset in cells A1 to A10.
- In a different cell, for example, B1, enter the formula =STDEV.S(A1:A10).
- Press Enter to obtain the sample standard deviation.
The STDEV.S function will return the sample standard deviation of the values in the specified range.
Note that the STDEV.S function assumes that the dataset represents a sample and not the entire population. If you have the entire population data, it is recommended to use the STDEV.P function instead, which will be discussed later in this article.
By using the STDEV.S function, you can accurately calculate the sample standard deviation of your dataset, making it ideal for statistical analysis when dealing with sample data.
Now that you’re familiar with the STDEV.S function, let’s explore another variation of the standard deviation function called STDEV.P.
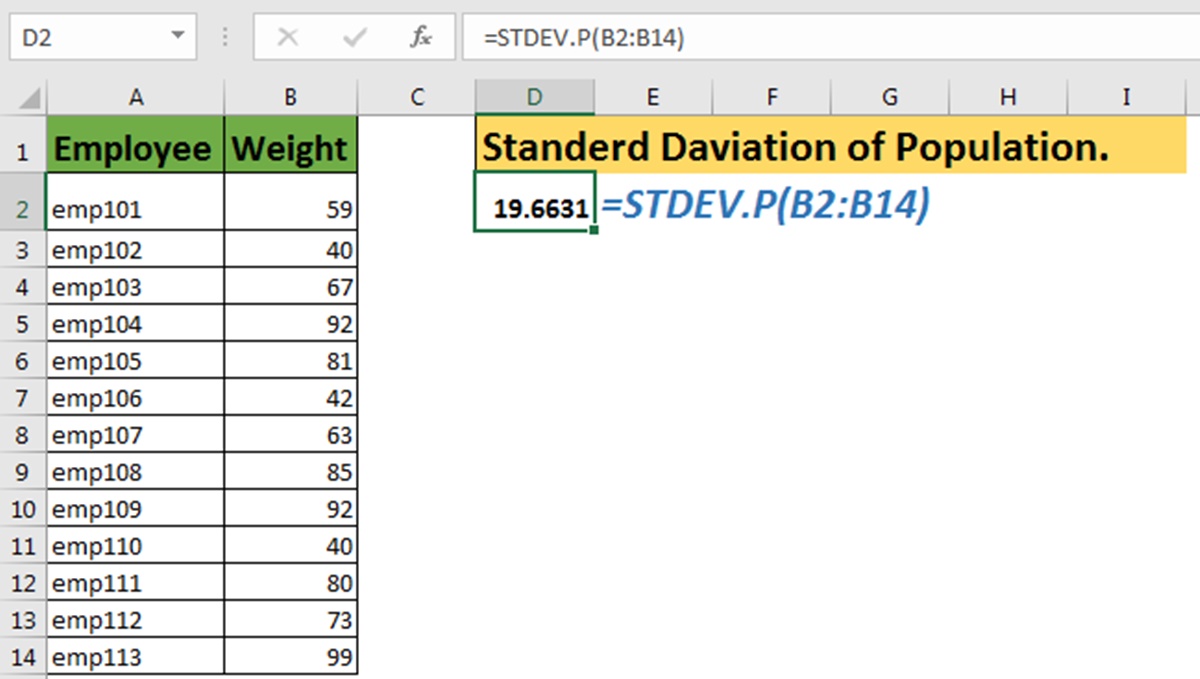
Using the STDEV.P Function
The STDEV.P function is another variation of the standard deviation calculation in Excel. The STDEV.P function is used to calculate the standard deviation of an entire population, rather than a sample from the population.
The syntax of the STDEV.P function is similar to the other standard deviation functions:
- =STDEV.P(number1, [number2], [number3], …)
The STDEV.P function requires numeric values or ranges as its arguments and can accept up to 255 numbers or ranges.
The STDEV.P function uses a different formula compared to the STDEV.S function. It calculates the standard deviation of the entire population by dividing the sum of the squared differences between each value and the population mean by the population size, without subtracting 1.
To use the STDEV.P function, follow these steps:
- Select the cell where you want the result to be displayed.
- Type =STDEV.P( to start the function.
- Enter the numeric values or ranges for which you want to calculate the standard deviation.
- Close the function by typing ) and press Enter.
Here’s an example to illustrate the usage of the STDEV.P function:
- Assume you have a population dataset in cells A1 to A10.
- In a different cell, for example, B1, enter the formula =STDEV.P(A1:A10).
- Press Enter to obtain the population standard deviation.
The STDEV.P function will calculate and display the standard deviation of the entire population represented by the specified range.
It is important to use the STDEV.P function when you have complete population data available. If you are working with a sample dataset, it is recommended to use the STDEV.S function instead to calculate the sample standard deviation.
By using the appropriate standard deviation function, whether it be STDEV.P or STDEV.S, you can accurately assess the variability or dispersion of data based on the size of the dataset or population.
Now that you’re familiar with the STDEV.P function, let’s explore two more variations of the standard deviation function called STDEVA and STDEVPA.
Using the STDEVA Function
The STDEVA function in Excel is another variation of the standard deviation calculation. The STDEVA function is used to calculate the standard deviation of a dataset that includes both numeric and text values.
The syntax of the STDEVA function is similar to the other standard deviation functions:
- =STDEVA(value1, [value2], [value3], …)
The STDEVA function accepts a series of values as its arguments, including both numeric and text values. It can accommodate up to 255 values.
The STDEVA function treats text values as zero (0) when performing the standard deviation calculation. It includes the numeric values in the dataset while ignoring the text values during the calculation.
To use the STDEVA function, follow these steps:
- Select the cell where you want the result to be displayed.
- Type =STDEVA( to start the function.
- Enter the values, including numeric and text, for which you want to calculate the standard deviation.
- Close the function by typing ) and press Enter.
Here’s an example to illustrate the usage of the STDEVA function:
- Assume you have a dataset in which cells A1 to A5 contain numeric values and cells B1 to B5 contain text values.
- In a different cell, for example, C1, enter the formula =STDEVA(A1:A5, B1:B5).
- Press Enter to obtain the standard deviation, excluding the text values.
The STDEVA function will calculate and display the standard deviation of the numeric values in the specified ranges, while ignoring the text values.
Using the STDEVA function can be beneficial when dealing with datasets that include both numeric and text values. It allows you to analyze the variability of the numeric values while excluding the non-numeric entries.
Now that you’re familiar with the STDEVA function, let’s explore another variation of the standard deviation function called STDEVPA.
Using the STDEVPA Function
The STDEVPA function in Excel is an inclusive variation of the standard deviation calculation. The STDEVPA function is used to calculate the standard deviation of a population, including both numeric and text values.
The syntax of the STDEVPA function is similar to other standard deviation functions:
- =STDEVPA(value1, [value2], [value3], …)
Just like other standard deviation functions, the STDEVPA function allows you to enter multiple values as arguments, including both numeric and text values.
The STDEVPA function treats text values as zero (0) when calculating the standard deviation. It includes all values in the dataset, regardless of whether they are numeric or text.
To use the STDEVPA function, follow these steps:
- Select the cell where you want the result to be displayed.
- Type =STDEVPA( to start the function.
- Enter the values, including both numeric and text, for which you want to calculate the standard deviation.
- Close the function by typing ) and press Enter.
Here’s an example to illustrate the usage of the STDEVPA function:
- Assume you have a dataset in which cells A1 to A5 contain numeric values and cells B1 to B5 contain text values.
- In a different cell, for example, C1, enter the formula =STDEVPA(A1:A5, B1:B5).
- Press Enter to obtain the inclusive standard deviation.
The STDEVPA function will calculate and display the standard deviation of all the values within the specified ranges, considering both numeric and text entries.
Using the STDEVPA function can be useful when you need to calculate the standard deviation of a population that contains a mix of numeric and text values. It ensures that all values are taken into account, providing a comprehensive measure of the variability.
Now that you’re familiar with the STDEVPA function, let’s explore another variation called the STDEVP function.
Using the STDEVP Function
The STDEVP function in Excel is another variation of the standard deviation calculation. The STDEVP function is used to calculate the standard deviation of an entire population, including both numeric and text values.
The syntax of the STDEVP function is similar to other standard deviation functions:
- =STDEVP(value1, [value2], [value3], …)
The STDEVP function allows you to enter multiple values as arguments, including both numeric and text values. It considers all values in the dataset, regardless of their type, when calculating the standard deviation.
Unlike other standard deviation functions, the STDEVP function treats both numeric and text values appropriately during the calculation.
To use the STDEVP function, follow these steps:
- Select the cell where you want the result to be displayed.
- Type =STDEVP( to start the function.
- Enter the values, including both numeric and text, for which you want to calculate the standard deviation.
- Close the function by typing ) and press Enter.
Here’s an example to illustrate the usage of the STDEVP function:
- Assume you have a population dataset in which cells A1 to A5 contain numeric values and cells B1 to B5 contain text values.
- In a different cell, for example, C1, enter the formula =STDEVP(A1:A5, B1:B5).
- Press Enter to obtain the population standard deviation.
The STDEVP function will calculate and display the standard deviation of all the values within the specified ranges, considering both numeric and text entries.
By using the STDEVP function, you can accurately calculate the standard deviation of a population, regardless of whether it contains numeric or text values. This provides a comprehensive measure of the variability present in the entire population.
Now that you’re familiar with the STDEVP function, let’s explore a special variation called the STDEV.P.S function.
Using the STDEV.P.S Function
The STDEV.P.S function in Excel is a special variation of the standard deviation calculation. The STDEV.P.S function is used to calculate the standard deviation of a population where data is provided as a series of sample means.
The syntax of the STDEV.P.S function is:
- =STDEV.P.S(number1, [number2], [number3], …)
The STDEV.P.S function requires numeric values as its arguments, representing sample means. It can accept up to 255 numbers as inputs.
This function is particularly useful when analyzing data points that consist of sample means instead of the actual data. It calculates the standard deviation based on the variation between these mean values.
To use the STDEV.P.S function, follow these steps:
- Select the cell where you want the result to be displayed.
- Type =STDEV.P.S( to start the function.
- Enter the numeric values or ranges that represent the sample means for which you want to calculate the standard deviation.
- Close the function by typing ) and press Enter.
Here’s an example to illustrate the usage of the STDEV.P.S function:
- Assume you have a series of sample means in cells A1 to A10.
- In a different cell, for example, B1, enter the formula =STDEV.P.S(A1:A10).
- Press Enter to obtain the standard deviation based on the sample means.
The STDEV.P.S function will calculate and display the standard deviation of the sample means provided in the specified range.
Using the STDEV.P.S function can be beneficial when working with data represented by sample means rather than the raw data. It allows you to analyze the variation between these mean values, providing insight into the spread of the sample means.
Now that you are familiar with the STDEV.P.S function, let’s move on to providing examples of using the STDEV function in Excel.
Examples of Using the STDEV Function in Excel
Now that we have explored the various variations of the STDEV function in Excel, let’s dive into some examples to showcase how it can be used in practical scenarios.
Example 1: Calculating the Standard Deviation of Exam Scores
Assume you have a dataset of exam scores in cells A1 to A10. To calculate the standard deviation of these scores, you can use the following formula:
- =STDEV(A1:A10)
This formula will provide you with the standard deviation of the exam scores, giving you an understanding of the variation among the student’s performance.
Example 2: Analyzing Stock Returns
Suppose you have a dataset in cells A1 to A20 representing the historical returns of a stock. To calculate the standard deviation of these returns, you can use the STDEV function as follows:
- =STDEV(A1:A20)
By calculating the standard deviation, you can assess the volatility or risk associated with the stock’s returns.
Example 3: Evaluating Sales Performance
If you have a dataset in cells A1 to A12 recording monthly sales figures, you can use the STDEV function to analyze the sales performance. The following formula calculates the standard deviation of the sales figures:
- =STDEV(A1:A12)
This will provide you with a measure of the variability in the monthly sales, helping you understand the consistency or fluctuations in sales performance.
These examples demonstrate how the STDEV function can be used in different scenarios, such as analyzing exam scores, assessing stock returns, or evaluating sales performance. By calculating the standard deviation, you can gain valuable insights into the variability and spread of the data.
Experiment with the STDEV function in Excel using your own datasets and explore how it can help you analyze and understand the variability in your data.