
Overview of the Netstat Command
The Netstat command is a powerful tool used in networking to gather information about active network connections, monitor listening ports, and analyze network statistics. It is available in most operating systems, including Windows, Linux, and MacOS. By running the Netstat command, you can gain valuable insights into the current status of your network and troubleshoot potential issues.
Netstat, short for “network statistics,” provides a comprehensive overview of the network connections established on your system. It displays detailed information such as the IP addresses, TCP/UDP ports, and the current state of each connection. This information is vital for network administrators and individuals troubleshooting network-related problems.
Another essential use of the Netstat command is to identify listening ports on your system. Listening ports are the entry points for incoming network connections. By using Netstat, you can determine which ports are open and the associated processes using them. This knowledge helps in identifying potential security vulnerabilities and unauthorized access attempts.
Furthermore, Netstat provides valuable network statistics that can help monitor the performance and stability of your network. It presents information such as the total number of active connections, the amount of data transmitted and received, and various other parameters. By regularly monitoring these statistics, you can detect anomalies, identify bandwidth bottlenecks, and optimize network resources.
The Netstat command also offers the flexibility to filter results using various options. You can specify criteria such as protocol type, IP address, port number, or specific command-line switches to narrow down the output. This filtering capability allows you to focus on specific network connections or processes, making it easier to analyze and troubleshoot network issues.
Netstat also supports advanced commands that provide deeper insights into network activities. For example, you can use the “-an” option to display all network connections and ports in numerical form, which can be useful in scripting or parsing the output. Other advanced options include displaying routing table information, multicast group membership, and more.
In summary, the Netstat command is a versatile tool that helps network administrators and individuals monitor and troubleshoot network connections, analyze listening ports, and gather network statistics. By leveraging the power of Netstat, you can gain valuable insights into your network’s health and ensure optimal network performance.
Checking Active Network Connections
One of the primary functions of the Netstat command is to provide information about active network connections on your system. By running Netstat with the appropriate options, you can gather details about the current state, IP addresses, and ports of all established connections.
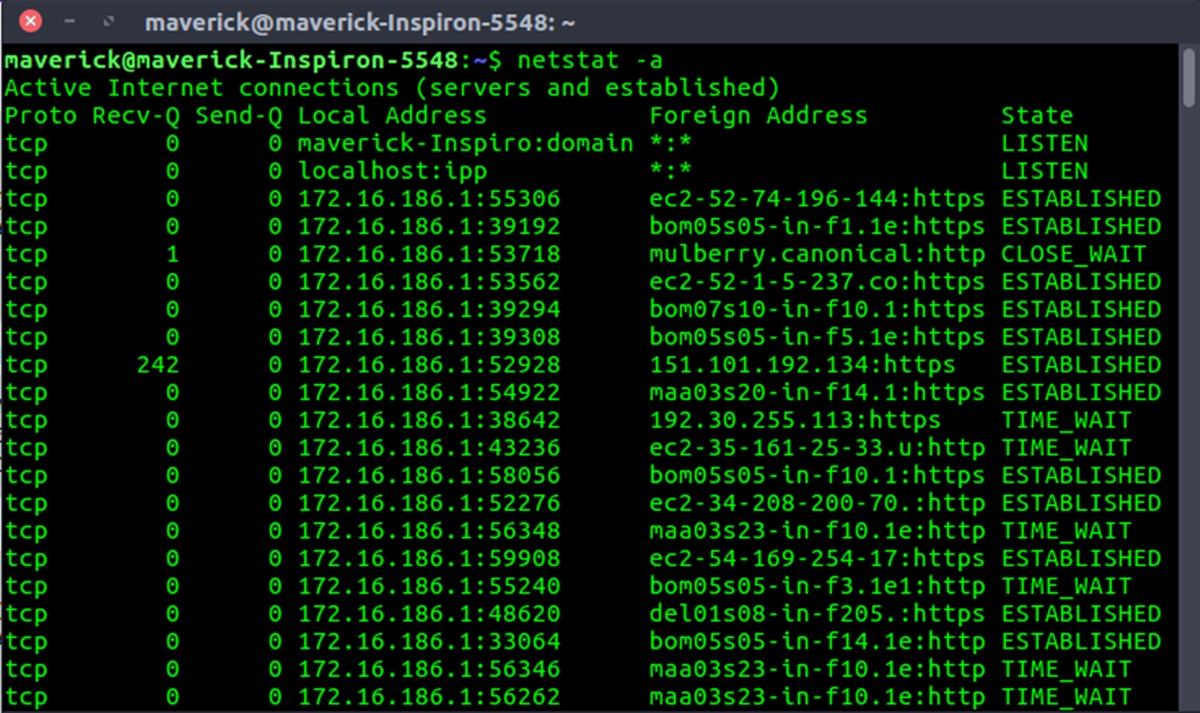
When checking active network connections, you can use the “-a” or “-p” options to display all connections or filter the results based on a specific protocol, respectively. For example, running “netstat -a” will show a list of all TCP and UDP connections, while “netstat -p tcp” will only display TCP connections.
Each entry in the Netstat output represents a network connection and includes information such as the local and remote IP addresses, the port numbers, and the current state of the connection. The state can indicate whether the connection is established, listening, or in a closed or timed-wait state.
By analyzing the active network connections, you can identify any suspicious or unauthorized connections. For instance, if you notice an established connection with an unfamiliar IP address, it may indicate unauthorized access to your system. In such cases, prompt action should be taken to investigate and block any potential security threats.
In addition to security purposes, checking active network connections can be beneficial for monitoring network usage and identifying resource-intensive connections. By observing the amount of data transmitted and received by each connection, you can pinpoint network endpoints that are consuming excessive bandwidth or causing network congestion. This information allows you to optimize network resources, improve performance, and prioritize critical network traffic.
Moreover, Netstat provides the option to display the process ID (PID) and the program name (command) associated with each connection. Using the “-b” or “-o” options, you can retrieve this detailed information. This feature is particularly helpful when troubleshooting network-related issues caused by specific applications or processes.
Overall, checking active network connections with the Netstat command gives you valuable insights into the state of your network. It helps in identifying unauthorized access, monitoring network usage, and troubleshooting network performance issues. By regularly examining active connections, you can maintain a secure and efficient network environment.
Investigating Listening Ports
When it comes to network security, one crucial aspect is identifying and investigating listening ports on your system. Listening ports are network endpoints that wait and accept incoming connections from remote devices. The Netstat command is an invaluable tool for examining these ports and understanding which processes are utilizing them.
By running the Netstat command with the appropriate options, such as “-n” to display numerical IP addresses and ports, and “-o” to show the associated process ID (PID), you can gather detailed information about the listening ports on your system.
Investigating listening ports allows you to have a clear overview of the services or applications that are actively waiting for incoming connections. This knowledge helps in understanding the network traffic patterns and identifying potential security risks. For example, if you notice a listening port for a well-known service like FTP or SSH that you don’t use, it could indicate a security vulnerability or an unauthorized service running on your system.
Furthermore, by examining the listening ports, you can identify any open ports that should not be exposed or accessible from the Internet. Some applications may configure listening ports that only need to accept connections from specific IP addresses or local networks. If you come across open ports that should be restricted, it is essential to address these configuration issues to prevent unauthorized access.
Netstat also provides information about the state of the listening ports, such as “LISTENING” or “ESTABLISHED”. The “LISTENING” state indicates that the port is actively waiting for incoming connections, while the “ESTABLISHED” state means that there is an existing connection on that port. Monitoring these states can help you identify potential issues, such as an unusually high number of established connections, which may indicate a denial-of-service (DoS) attack or a compromised system.
Additionally, Netstat allows you to identify the processes associated with each listening port. By using the “-b” option (available in Windows), you can view the command name or executable that initiated the listening port. This information is invaluable when troubleshooting network-related problems or when you need to identify and terminate specific processes that are causing issues.
In summary, investigating listening ports with the Netstat command is crucial for network security and troubleshooting. It helps you identify potential security vulnerabilities, understand network traffic patterns, and ensure that only desired services are exposed to the network. By regularly examining listening ports, you can maintain a more secure and controlled network environment.
Displaying Network Statistics
Displaying network statistics using the Netstat command can provide valuable insights into the performance and utilization of your network. By running Netstat with the appropriate options, you can view various statistics related to network connections, data transmission, and network interfaces.
Netstat provides information such as the total number of active connections, both TCP and UDP, on your system. This data can give you an overview of the network activity and the number of concurrent connections being handled. Monitoring the number of connections is particularly useful for network administrators to identify patterns, spot unusual traffic, and plan network capacity accordingly.
Another crucial aspect of network statistics is monitoring the amount of data transmitted and received. Netstat allows you to view the number of transmitted and received packets, as well as the amount of data in bytes. These statistics are key to understanding the network’s bandwidth utilization and identifying potential bottlenecks. By analyzing the data transmission rates, you can optimize network resources, ensure efficient data transfer, and detect any abnormal network behavior.
In addition to packet and data statistics, Netstat provides information on errors encountered during network connections. These errors could include connection timeouts, reset connections, or other network-related issues. Monitoring these error statistics can help diagnose and troubleshoot network problems, ensuring a stable and reliable network environment.
Netstat also provides network interface statistics, enabling you to analyze the performance of individual network interfaces on your system. By using the “-e” option (available in Windows), you can view parameters such as the number of packets and bytes transmitted and received by each interface. This information helps in identifying network interfaces that may be overloaded, experiencing high traffic, or encountering errors.
Furthermore, Netstat allows you to monitor the multicast group membership statistics on your system. Multicast group membership indicates the number of multicast groups that your network interfaces are subscribed to. Tracking these statistics is essential in assessing the utilization of multicasting in your network environment.
Overall, by displaying network statistics with the Netstat command, you gain valuable insights into the performance, utilization, and error rates of your network. The information provided by Netstat allows you to optimize network resources, troubleshoot issues, and ensure a stable and efficient network environment.
Filtering Results with Options
The Netstat command provides various options that allow you to filter the results and focus on specific network connections or processes. These filtering options enhance the functionality of Netstat and make it easier to analyze and troubleshoot network issues.
One of the commonly used options is the “-p” option, which allows you to filter the results based on the protocol type. By specifying either “tcp” or “udp”, you can view only the TCP or UDP connections, respectively. This filtering capability is particularly useful when you are interested in analyzing connections of a specific protocol or troubleshooting issues related to a specific transport layer protocol.
Another valuable feature is the ability to filter the results based on a specific IP address or port number. Using the “-s” option followed by the IP address or port number, you can narrow down the output to connections that match the specified criteria. This is useful when you want to examine connections associated with a particular IP address or port, or when you want to investigate network activities related to a specific service or application.
Netstat also allows you to filter the results based on the state of the network connections. This is achieved by using the “-o” option (available in Windows) to display the process ID (PID) associated with each connection. By combining the “-o” option with the “-p” option, you can filter the results based on the process name. This filtering capability is especially helpful when you want to identify the processes responsible for specific network connections or troubleshoot issues caused by specific applications.
Additionally, the Netstat command offers the flexibility to display the results in a numerical format using the “-n” option. This option allows you to view IP addresses and port numbers as numerical values rather than attempting to resolve them to hostnames. This can significantly speed up the display of results, especially when dealing with a large number of connections.
Furthermore, Netstat provides advanced filtering options to refine the output even further. For example, you can use regular expressions to match specific patterns in the results, allowing for more complex and granular filtering. This feature is particularly beneficial when you need to analyze connections based on specific criteria or perform advanced troubleshooting tasks.
In summary, the filtering options available in the Netstat command enable you to narrow down the results and focus on specific network connections or processes. By utilizing these options, you can analyze network activities related to specific protocols, IP addresses, port numbers, or even specific processes or applications. The ability to filter results enhances the efficiency and effectiveness of using Netstat for network analysis and troubleshooting.
Advanced Netstat Commands
The Netstat command offers advanced functionalities and commands that provide deeper insights into network activities. These advanced commands allow for more detailed analysis, troubleshooting, and monitoring of network connections.
One of the useful advanced commands is the “-c” option, which enables continuous refreshing of the Netstat output. By running Netstat with the “-c” option, you can observe real-time changes in network connections, making it easier to track network activities as they occur. This command is particularly helpful when monitoring for sudden spikes in network traffic or when troubleshooting intermittent connection issues.
Another powerful advanced command is the “-r” option, which displays the routing table information. The routing table maps IP addresses to network interfaces and determines the path of network packets. By using this command, you can view the routing table entries on your system, including the destination IP address, subnet mask, gateway address, and interface index. Understanding the routing table is essential for troubleshooting network connectivity issues and ensuring proper routing of network traffic.
Netstat also offers the “-g” option, which allows you to view multicast group membership information. Multicast group membership indicates the multicast groups that your network interfaces are subscribed to. This command provides insights into the usage of multicast in your network environment and helps in troubleshooting multicast-related issues.
Furthermore, advanced Netstat commands allow you to display extended TCP/IP statistics. By using the “-s” option, you can view detailed statistics on TCP connections, UDP datagrams, IP data, and ICMP messages. These extensive statistics provide a deeper understanding of network performance, utilization, and potential bottlenecks. By analyzing these statistics, you can identify patterns, detect anomalies, and fine-tune the configuration of your network.
Moreover, Netstat provides the ability to display the time interval between the successive updates of the Netstat output using the “-i” option. This command allows you to specify the time interval in seconds and observe changes in network connections at regular intervals. Monitoring network connections with a specific time interval is beneficial when analyzing network traffic patterns or conducting long-term network monitoring.
Additionally, the “-x” option allows you to display the network connections that were using Extended Services. Extended Services, such as Quality of Service (QoS) or Differentiated Services (DiffServ), provide advanced capabilities to manage network traffic. By using the “-x” option, you can identify connections that make use of these extended services and gain insights into their utilization and impact on network performance.
In summary, advanced Netstat commands enhance the capabilities of the Netstat command, allowing for more detailed analysis, troubleshooting, and monitoring of network connections. These commands provide real-time updates, routing table information, multicast group membership details, extended TCP/IP statistics, and insight into extended services utilization. By leveraging these advanced commands, network administrators can gain deeper insights into network activities and effectively manage and optimize their networks.
Troubleshooting Network Issues with Netstat
The Netstat command is a valuable tool for troubleshooting network issues. By running Netstat and analyzing the output, you can gather critical information about network connections, listening ports, and network statistics that aid in diagnosing and resolving network problems.
One common troubleshooting technique involves using Netstat to identify established connections and their associated processes. By examining the output of Netstat, you can identify any suspicious or unauthorized connections that may indicate a security breach or unauthorized access to your system. Once identified, you can take appropriate action to investigate and block any potential threats.
In addition to unauthorized access, Netstat can help identify network congestion or performance issues. By monitoring the active network connections, you can analyze the amount of data transmitted and received, identify resource-intensive connections, and detect any potential bottlenecks. This insight allows you to optimize network resources, prioritize critical traffic, and improve overall network performance.
Netstat can also assist in troubleshooting specific application connectivity issues. By inspecting the listening ports on your system, you can verify if a specific port is open and actively accepting incoming connections. This information is useful when diagnosing issues related to services or applications that rely on specific ports to function correctly. If a port is not open or accepting connections, it may indicate a misconfiguration or a problem with the associated service or application.
Additionally, Netstat provides information on the state of network connections, such as “LISTENING” or “ESTABLISHED”. Monitoring these states can help identify connection-related issues, such as excessive connections in the “ESTABLISHED” state, which may indicate a denial-of-service (DoS) attack or an overloaded system. Being able to identify and investigate these states allows for prompt action and resolution.
Furthermore, Netstat’s advanced commands, such as displaying extended TCP/IP statistics or routing table information, can be valuable in troubleshooting complex network problems. By examining these additional details, you can gain deeper insights into network performance, traffic patterns, and routing issues. This information assists in pinpointing the root cause of network problems and formulating appropriate solutions.
Finally, when combined with other network troubleshooting tools or techniques, Netstat becomes even more powerful. For example, running Netstat alongside ping or traceroute can help identify network connectivity issues or routing problems. The combination of these tools provides a more comprehensive picture of network health and aids in troubleshooting more effectively.
In summary, using the Netstat command to troubleshoot network issues provides crucial information about network connections, listening ports, and network statistics. By leveraging the output of Netstat, network administrators can diagnose and resolve security breaches, performance issues, application connectivity problems, and other complex network problems. Netstat is a valuable tool in the network troubleshooting arsenal and helps ensure a stable and reliable network environment.