
What is a Gantt Chart?
A Gantt chart is a popular project management tool that visually represents a project schedule. It provides a clear overview of the tasks, their durations, and their dependencies. Named after its creator, Henry Gantt, a Gantt chart is particularly useful for managers, teams, and stakeholders to plan, organize, and track progress throughout the project lifecycle.
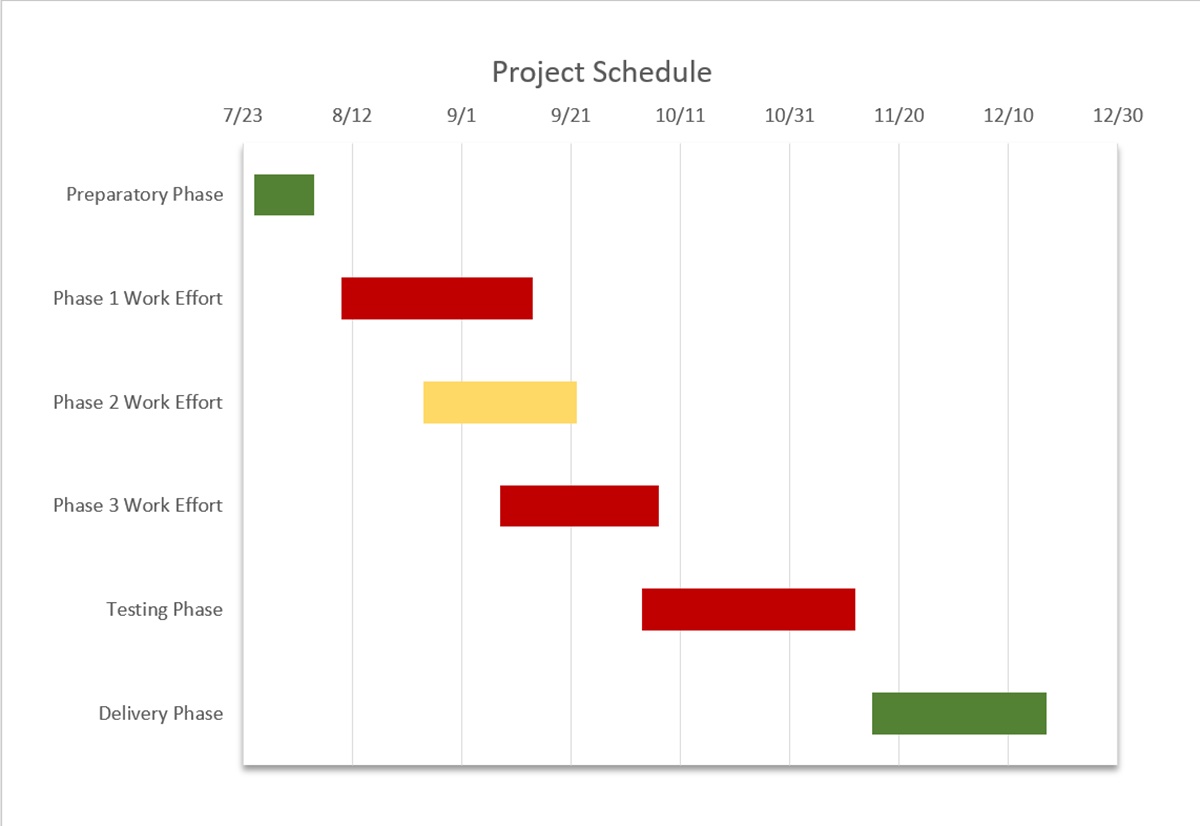
The chart consists of two key components: horizontal bars representing tasks or activities, and a timeline that represents the project’s duration. Each bar in the chart corresponds to a specific task, and its length indicates the task’s start and end dates. This visual representation makes it easy to identify the duration, overlap, and sequence of tasks, ensuring efficient project scheduling.
Gantt charts offer a multitude of benefits in managing projects. They provide a comprehensive view of the project, allowing teams to understand the project’s scope, deadlines, and dependencies at a glance. This tool promotes effective communication and collaboration among team members, enabling everyone to align their efforts and stay motivated towards the project’s objectives.
By breaking down complex projects into smaller tasks, a Gantt chart helps in better task allocation and resource management. It allows project managers to assign tasks to specific team members, determine the critical path, and allocate resources efficiently. This leads to improved productivity, reduced bottlenecks, and better utilization of resources.
Additionally, Gantt charts enable better tracking and monitoring of project progress. As tasks are completed, the chart visually updates to reflect the progress, providing a clear indication of how the project is advancing against the planned schedule. This helps in identifying delays or potential roadblocks early on, allowing for timely adjustments and mitigations.
Overall, a Gantt chart is a valuable project management tool that empowers teams to plan, coordinate, and execute projects effectively. Whether you are managing a small project or a large-scale endeavor, implementing a Gantt chart can enhance organization, communication, and productivity, leading to successful project outcomes.
Advantages of Using Gantt Charts
Gantt charts offer numerous advantages for project management. They provide a clear visual representation of a project’s schedule, enabling teams to effectively plan, monitor, and track progress. Let’s explore some key advantages of using Gantt charts:
1. Visual Representation: Gantt charts offer a visual means to communicate project timelines and dependencies. By representing tasks as bars on a timeline, it becomes easier to understand the overall project structure and the sequence of tasks.
2. Improved Planning: Gantt charts help in better project planning by breaking down complex projects into smaller, manageable tasks. This allows project managers to allocate resources, set realistic deadlines, and identify potential bottlenecks.
3. Task Dependency Management: Gantt charts clearly depict task dependencies, showing which tasks need to be completed before others can begin. This helps in understanding the critical path of a project and ensures that all tasks are executed in the correct order.
4. Resource Allocation: Gantt charts assist in resource management by providing a clear overview of task assignments and resource availability. They help ensure that resources are allocated efficiently and that team members are aware of their responsibilities.
5. Progress Tracking: With a Gantt chart, teams can easily track the progress of tasks and monitor how the project is advancing against the planned schedule. This allows for timely identification of delays or issues, enabling teams to take corrective actions and minimize project risks.
6. Enhanced Collaboration: Gantt charts promote collaboration and coordination among team members. They provide a visual platform for sharing project updates, assigning tasks, and communicating deadlines, ensuring everyone is on the same page.
7. Improved Time Management: By clearly indicating task durations and deadlines, Gantt charts facilitate time management. They help teams prioritize tasks, allocate time accordingly, and stay focused on meeting project milestones.
8. Efficient Resource Utilization: Gantt charts assist in optimizing resource utilization by identifying periods of high or low resource demand. This enables project managers to allocate resources effectively, preventing over or underutilization.
9. Stakeholder Communication: Gantt charts serve as a powerful communication tool for project stakeholders. They help present project timelines, progress, and milestones in a visually appealing manner, making it easier to convey project status to clients, executives, and other stakeholders.
10. Flexibility and Adaptability: Gantt charts allow for flexibility and adaptability in project management. If changes occur during the project, such as delays or scope adjustments, the chart can easily be updated to reflect the new schedule.
In summary, Gantt charts offer multiple advantages in project management, empowering teams to effectively plan, track progress, allocate resources, and communicate project status. By leveraging the visual representation and functionalities of Gantt charts, project managers can enhance project outcomes and ensure successful project delivery.
Preparing Your Data
Before creating a Gantt chart in PowerPoint, it is essential to gather and organize the necessary data to ensure accurate and effective representation of your project. Here are some key steps to help you prepare your data:
1. Define Tasks: Begin by identifying the individual tasks or activities required to complete your project. Break down the project into smaller, manageable tasks that can be easily represented in the Gantt chart.
2. Sequence Tasks: Determine the order in which tasks need to be performed. Identify any dependencies between tasks, such as tasks that must be completed before others can begin.
3. Estimate Durations: Estimate the duration or time required to complete each task. This will help you allocate resources and set realistic deadlines in the Gantt chart.
4. Assign Resources: Determine the resources required for each task, such as team members, equipment, or materials. Assign the appropriate resources to each task in order to effectively manage allocation.
5. Establish Milestones: Identify key milestones or significant points in your project. These milestones represent major achievements or deliverables and will help track progress in the Gantt chart.
6. Set Start and End Dates: Determine the start and end dates for each task based on the estimated durations and dependencies. This will form the baseline schedule for your project.
7. Consider Constraints: Take into account any constraints or limitations that may affect the project timeline, such as holidays, external dependencies, or availability of resources.
8. Update and Validate Data: Ensure that all task information, including durations, dependencies, resources, and dates, is accurate and up to date. Validate the data with your project team to confirm its completeness and accuracy.
9. Organize Data: Prepare your data in a structured format that is easy to input into the Gantt chart. You can use a spreadsheet or project management software to input and organize the task details.
By carefully preparing your data, you lay the foundation for a well-structured and accurate Gantt chart. This will enable you to effectively track and manage your project timeline and tasks within PowerPoint.
Choosing the Right Gantt Chart Template
When creating a Gantt chart in PowerPoint, selecting the right template is crucial to effectively represent your project’s timeline and tasks. Here are some factors to consider when choosing a Gantt chart template:
1. Design and Layout: Look for a template that has a clean and professional design, with clear labels and easy-to-read text. Ensure that the layout allows for easy identification of tasks, timelines, and dependencies.
2. Customizability: Consider whether the template allows for customization to suit your project’s specific needs. Templates that offer flexibility in adjusting colors, fonts, and formatting will allow you to personalize the chart and align it with your project’s branding or visual style.
3. Task Representation: Evaluate how tasks are visually represented in the template. Look for templates that use horizontal bars or blocks to represent tasks, as this makes it easier to understand the duration and overlap of activities.
4. Timeline Scale: Consider the scale of the timeline in the template. Determine whether it provides an appropriate level of detail for your project’s timeline, allowing you to clearly see the start and end dates of tasks.
5. Dependencies and Relationships: Check whether the template includes features to show task dependencies and relationships. Templates that visually represent dependencies with arrows or lines connecting tasks will help you understand the logical sequence of activities.
6. Milestone Representation: Assess how milestones are displayed in the template. Look for templates that clearly highlight milestones as significant checkpoints or deliverables in the project timeline.
7. Data Input and Management: Consider how easy it is to input and manage your project’s data within the template. Templates that offer spreadsheet-like functionality or integration with project management software can streamline data input and updates.
8. Collaboration and Sharing: Evaluate whether the template allows for easy collaboration and sharing of the Gantt chart. Look for templates that enable real-time collaboration or have options to export the chart in popular file formats for sharing with team members or stakeholders.
9. Template Functionality: Assess whether the template includes additional features or functionality that align with your project management needs. Some templates may include features like progress tracking, resource allocation, or task categorization.
10. User Reviews and Recommendations: Consider user reviews and recommendations when selecting a Gantt chart template. Look for templates that have positive feedback regarding usability, reliability, and overall satisfaction.
By carefully considering these factors, you can choose a Gantt chart template that meets your project’s requirements and effectively represents your project’s timeline and tasks in PowerPoint.
Creating a Gantt Chart from Scratch
Creating a Gantt chart from scratch in PowerPoint allows you to have full control over the design and customization of your project schedule. Here are the steps to follow when creating a Gantt chart from scratch:
1. Open PowerPoint: Launch PowerPoint on your computer and start a new presentation or open an existing one.
2. Insert a Blank Slide: Insert a blank slide where you want to create your Gantt chart. You can do this by clicking on the “Insert” tab in the top menu and selecting “New Slide” or by using the keyboard shortcut Ctrl+M.
3. Draw a Horizontal Timeline: Draw a horizontal line or shape on the slide to represent the timeline of your project. Use the “Shapes” option in the “Insert” tab to create a line or rectangle, and adjust its size and position to fit your slide.
4. Add Task Bars: Use rectangles or bars to represent tasks on the timeline. Draw a rectangle for each task and position it on the timeline according to its start and end dates. Adjust the length of each rectangle to match the task’s duration.
5. Include Milestones: Add milestone markers to indicate significant events or achievements in your project. Use shapes like diamonds or star symbols to represent milestones, and position them on the timeline accordingly.
6. Label Tasks and Milestones: Add text labels above or below each task and milestone to provide a clear description. Use the text box tool in the “Insert” tab to add labels, and adjust their size, font, and position as needed.
7. Add Task Dependencies: Connect related tasks with lines or arrows to represent task dependencies. Use line shapes or arrow shapes from the “Shapes” option, and position them between tasks to indicate the logical sequence.
8. Adjust Task Bar Colors: Customize the colors of the task bars to distinguish different types of tasks or to align with your project’s branding. Use the “Format” tab and the “Shape Fill” option to change the color of each task bar.
9. Fine-tune the Design: Refine the visual elements of your Gantt chart, such as adjusting the size of the timeline, adding gridlines, or changing font styles. Use the options in the “Format” tab to make these adjustments.
10. Update and Maintain: Once your Gantt chart is created, maintain it by updating task progress, adding new tasks, or adjusting dates as needed. Regularly review and update the chart to reflect the current status of your project.
Remember to save your PowerPoint presentation regularly to ensure that your Gantt chart is preserved. With the ability to create a Gantt chart from scratch, you can tailor it to fit your project’s unique requirements and present your project schedule in a visually impactful way.
Adding Tasks and Milestones
Tasks and milestones are the building blocks of a Gantt chart, representing the activities and key events in your project. Adding tasks and milestones to your Gantt chart in PowerPoint is a straightforward process. Here’s how you can do it:
1. Identify Tasks: Start by identifying the tasks or activities required to complete your project. Break down the project into smaller, manageable tasks that can be represented in the Gantt chart. Be specific and descriptive when naming tasks to ensure clarity.
2. Insert Task Bars: To add tasks to your Gantt chart, draw rectangles or bars on the timeline representing each task. Use the “Shapes” option in the “Insert” tab to create rectangles, and adjust their size and position to fit the project timeline. Each bar should correspond to a specific task.
3. Label Tasks: Add text labels above or below each task bar to clearly describe the task. Use the text box tool in the “Insert” tab to add labels, and customize the font, size, and style to ensure readability. The labels should provide a concise and informative description of each task.
4. Position Tasks on the Timeline: Place each task bar on the timeline according to its planned start and end dates. Align the left edge of the bar with the start date and adjust the length to correspond to the task’s duration. Ensure that tasks do not overlap and are positioned correctly in sequence.
5. Add Milestone Markers: Milestones are significant events or achievements in your project. To add milestones to your Gantt chart, insert specific shapes (such as diamonds or star symbols) on the timeline to represent each milestone. Position the markers at the appropriate date on the timeline to indicate when they will occur.
6. Label Milestones: Similar to tasks, add text labels to each milestone marker to describe the event or achievement it represents. Place the labels adjacent to or below the milestone markers. Ensure the labels are clear and concise, conveying the importance of each milestone.
7. Customize Task and Milestone Appearance: Customize the appearance of task bars and milestone markers to enhance their visibility and differentiate them from one another. Use colors, fill patterns, or border styles to distinguish tasks and milestones. Consistent styling can aid in easy identification.
8. Update and Maintain: Regularly update your Gantt chart by adding new tasks or milestones as they arise in your project. Adjust the timeline, task bars, and milestone markers as necessary to reflect any changes in the project schedule. Keep the chart up to date to maintain accuracy and clarity.
By following these steps, you can easily incorporate tasks and milestones into your Gantt chart, creating a visual representation of your project’s activities and key events. This will help you and your team stay organized and have a clear understanding of the project progression.
Setting Start and End Dates
Setting accurate start and end dates is crucial for creating a Gantt chart that effectively represents your project’s timeline. By assigning the appropriate dates to tasks and milestones, you can visualize the project’s schedule and ensure smooth progress. Here’s how you can set start and end dates in your Gantt chart:
1. Task Analysis: Begin by analyzing each task and determining the ideal start date. Consider any dependencies that may affect the start date, such as tasks that need to be completed before others can begin. Evaluate the resources needed for each task and any constraints that could impact the timeline.
2. Assign Start Dates: Once you have analyzed the tasks, assign a start date to each one. For tasks without dependencies, the start date will be the planned start date of the project. For tasks with dependencies, the start date will be the completion date of the preceding task.
3. Determine Task Durations: Estimate the duration or time required to complete each task. This will help you determine the end date for each task. Consider factors such as the complexity of the task, the resources available, and any potential risks or obstacles that could impact the timeline.
4. Calculate End Dates: Calculate the end date of each task by adding the estimated duration to the start date. Ensure that the end dates align with the project’s overall timeline and objectives. Adjust the task durations and dependencies as needed to create a realistic and achievable schedule.
5. Set Milestone Dates: For milestones, identify the key events or achievements within the project and assign specific dates to them. Milestones represent important checkpoints and help track progress. Place the milestone markers on the timeline at their respective dates.
6. Account for Constraints and Delays: Consider any constraints or potential delays that may affect the start and end dates of tasks. Account for factors such as holidays, resource limitations, or external dependencies that could impact the timeline. Adjust the dates accordingly to reflect any constraints.
7. Review and Validate Dates: Before finalizing your Gantt chart, review and validate the start and end dates. Ensure that the assigned dates are accurate and realistic. Validate the timeline with your project team to confirm that it aligns with project expectations and allows for successful completion.
8. Update and Adjust Dates: Throughout the project, monitor and update the start and end dates of tasks as needed. If there are any changes in dependencies, resource availability, or project scope, make the necessary adjustments to ensure an up-to-date and accurate Gantt chart.
By setting start and end dates effectively, you can create a Gantt chart that visually represents your project’s timeline and facilitates efficient project management. Regularly review and adjust the dates as the project progresses to maintain an accurate and realistic schedule.
Adjusting the Duration
Adjusting the duration of tasks in your Gantt chart is an important step in accurately representing the time required to complete each task. By making necessary adjustments to task durations, you can better manage your project’s timeline and ensure its successful execution. Here’s how you can effectively adjust the duration in your Gantt chart:
1. Review Initial Duration: Start by reviewing the initial duration estimates for each task. Consider factors such as task complexity, available resources, and potential risks that could impact the timeline. Assess whether the initial duration aligns with the project goals and constraints.
2. Evaluate Task Dependencies: Examine the dependencies between tasks. If a task has dependent tasks, consider how changes in the duration of the current task may affect the overall timeline. Analyze potential implications and discuss with the project team to determine the feasibility of adjusting the duration.
3. Identify Potential Delays: Identify any potential delays or obstacles that may impact the task duration. Factors such as resource availability, unexpected challenges, or changes in project scope can affect the time required to complete a task. Anticipate and account for these potential delays when adjusting the duration.
4. Consider Optimal Timeframes: Assess whether there are any optimal timeframes for completing certain tasks. For example, some tasks may be more efficiently executed during specific time periods or when certain resources are available. Consider these factors when adjusting the duration to optimize task completion.
5. Adjust Task Duration: Once you’ve considered all relevant factors, make the necessary adjustments to the task duration. Increase or decrease the estimated time required to complete each task based on the analysis conducted. Ensure that the adjusted duration provides a realistic timeframe for task completion.
6. Update Dependencies: If you adjust the duration of a task that has dependent tasks, update the dependencies accordingly. Assess if any changes are needed in the sequence or timing of related activities to maintain a logical and efficient project flow.
7. Communicate Changes: Inform your team members and stakeholders about the adjusted task durations. Clearly communicate the reasons for the adjustments and ensure that everyone is aware of the new timeline. This promotes transparency and alignment within the project.
8. Continuously Monitor and Adjust: Throughout the project, closely monitor the progress of tasks and evaluate if further adjustments are needed. Regularly review the duration of tasks to ensure they remain accurate and up to date. Address any unforeseen circumstances and make necessary adjustments promptly.
By effectively adjusting task durations, you can create a Gantt chart that reflects the realistic timeline of your project. Consistently monitoring and adjusting durations will help you stay on track and successfully manage your project to completion.
Adding Dependencies
In project management, dependencies represent the relationships between tasks and determine the sequence in which they need to be completed. Adding dependencies to your Gantt chart is crucial for visualizing the logical flow of activities and ensuring that tasks are completed in the correct order. Here’s how you can effectively add dependencies to your Gantt chart:
1. Identify Task Dependencies: Begin by identifying the dependencies between tasks in your project. Review the task list and determine which tasks need to be completed before others can start. Identify both finish-to-start dependencies (where one task must end before another can start) and other types of dependencies, such as start-to-start, finish-to-finish, or start-to-finish.
2. Represent Dependencies: Choose a suitable visual representation to indicate the dependencies between tasks on your Gantt chart. Common options include arrows, lines, or connectors that connect dependent tasks. These visual cues help illustrate the relationships between tasks and the order in which they should be completed.
3. Connect Dependent Tasks: Use the drawing tools available in PowerPoint to connect the dependent tasks with the chosen visual representation. For example, draw a line or arrow from the end of the predecessor task bar to the start of the successor task bar to indicate a finish-to-start dependency.
4. Label Dependencies: Label the dependencies to provide clarity for each connection. You can use text boxes or callouts to describe the relationship between the tasks. Clearly state the type of dependency (e.g., FS for finish-to-start) and any additional information that helps define the nature of the dependency.
5. Update Dependencies When Changes Occur: As your project progresses, assess the impact of any changes on task dependencies. If there are modifications in the project plan, task durations, or priority, make the necessary adjustments to the dependencies. Update the connections, labels, and any other relevant information to reflect the revised dependency relationships.
6. Avoid Circular Dependencies: Ensure that you do not create circular dependencies, where tasks are dependent on one another in an endless loop. Circular dependencies can lead to project delays and complications. Review the dependencies carefully to detect and resolve any potential circular dependencies.
7. Validate Dependencies: Regularly review and validate the dependencies with your project team to ensure accuracy. Verify that the dependencies accurately represent the order and relationships between tasks. Seek input from team members who are directly involved in the execution of the tasks to confirm the dependencies.
8. Communicate Dependencies: It is essential to communicate the dependencies to the project team and stakeholders. Share the Gantt chart with clear visual representations of the dependencies to ensure everyone understands the task sequence and the importance of completing tasks in the designated order.
By adding dependencies to your Gantt chart, you create a visual roadmap that demonstrates the logical flow of tasks in your project. Accurate representation of dependencies enables effective planning, sequencing, and monitoring of the project’s activities, ultimately leading to successful project outcomes.
Inserting Progress Bars
Progress bars in a Gantt chart provide a visual representation of the completion status of tasks, allowing project managers and team members to track progress easily. Adding progress bars to your Gantt chart in PowerPoint helps communicate the project’s current status and ensures transparency and accountability. Here’s how you can effectively insert progress bars in your Gantt chart:
1. Determine Progress Measurement: Decide on the method you will use to measure task progress. This could be based on task completion percentage or specific milestones. Clearly define what constitutes each level of progress and how it will be represented visually.
2. Create Bar Overlay: Select the task bar that needs a progress bar overlay. Use the “Shapes” option in the “Insert” tab to draw a rectangle or bar of the same width as the original task bar, positioned on top of it. This overlay will represent the progress of the task.
3. Resize Progress Bar: Adjust the length of the progress bar overlay to reflect the level of completion. For example, if a task is 50% complete, resize the progress bar overlay to cover half of the task bar width. Align the left edge of the progress bar overlay with the start date of the task.
4. Choose Progress Bar Color: Select a color for the progress bar overlay that stands out and indicates progress clearly. Use the “Shape Fill” option in the “Format” tab to change the color. It is common to use shades or gradients of a single color to represent different stages of progress.
5. Update Progress Regularly: Continuously update the progress bars in your Gantt chart as tasks are completed or as progress milestones are achieved. When a task reaches a new level of completion, adjust the length of the progress bar overlay accordingly.
6. Communicate Progress: Clearly communicate the meaning of the progress bars to your team members and stakeholders. Provide a legend or a brief explanation of how the progress bars are interpreted. Ensure that everyone understands the relationship between the progress bar and task completion.
7. Include Remaining Timeline: If desired, add a separate line or bar to represent the remaining estimated time or duration for each task. This can provide additional context and help track the remaining work required for each task.
8. Highlight Delays or Issues: If a task is behind schedule or facing a delay, adjust the progress bar overlay accordingly to reflect the actual progress. This will help to visually highlight any potential issues or areas that require attention.
9. Regularly Review and Adjust: Review the progress bars in your Gantt chart periodically to ensure they accurately reflect the current status of the project. Update the progress bars as needed, taking into account any changes in task durations, dependencies, or priorities.
By inserting progress bars into your Gantt chart, you provide a dynamic and visual representation of task progress. This allows for effective tracking, monitoring, and communication of project status, helping to keep everyone informed and aligned towards project goals.
Customizing the Gantt Chart
Customizing your Gantt chart allows you to tailor its appearance and functionality to meet your project’s specific needs and enhance visual clarity. By adjusting various elements, you can create a chart that is visually appealing and effectively communicates project details. Here are some customization options to consider when working on your Gantt chart:
1. Adjusting Color Scheme: Choose a color scheme that aligns with your project’s branding or visual identity. Select colors that are visually appealing, distinct, and easily distinguishable for task bars, milestones, progress indicators, and other elements.
2. Modifying Font and Text Formatting: Customize the font style, size, and formatting of the text used in your Gantt chart. Ensure that the font is readable and consistent throughout the chart. Experiment with bold or italicized text variations to highlight important information.
3. Adding Gridlines: Insert gridlines to improve the readability and structure of your Gantt chart. Gridlines can help in aligning and spacing tasks, ensuring the timeline is accurately represented. Adjust the appearance and spacing of the gridlines for better visual organization.
4. Including Legends and Labels: Create legends or labels to provide additional information and context to your Gantt chart. Legends can help clarify color coding, task types, or other visual indicators used in the chart. Labels can provide descriptions or notes for specific elements, such as milestones or dependencies.
5. Utilizing Symbols or Icons: Incorporate symbols or icons to further enhance the visual representation of your Gantt chart. Icons can be used to represent specific task types, important milestones, or other key elements. Ensure that the symbols are easily recognizable and their meaning is communicated clearly.
6. Adding Headers and Titles: Consider adding headers or titles to your Gantt chart to provide clarity and organization. Use headings to categorize groups of tasks or to differentiate different phases of the project. Include titles to clearly indicate the purpose or subject of the chart.
7. Applying Animation or Transitions: Enhance the visual experience of your Gantt chart by using animations or transitions. Add simple animations to elements such as task bars or milestones to bring attention to specific areas of the chart. Ensure that the animations do not distract from the readability of the chart.
8. Highlighting Critical Path: Emphasize the critical path of your project by adding a distinct style or color to tasks that lie on the critical path. This provides clarity on the most crucial tasks for meeting project deadlines and can help in priority management.
9. Using Data Visualization Techniques: Consider incorporating data visualization techniques, such as bar charts or pie charts, to display project metrics or performance indicators alongside the Gantt chart. This can provide additional insights and context to stakeholders and aid in decision-making processes.
10. Testing and Iterating: Regularly review and test the customization options you have applied to your Gantt chart. Seek feedback from team members and stakeholders to ensure that the chart is effectively conveying the desired information. Iterate and make adjustments as needed to improve the chart’s usability and visual impact.
By customizing your Gantt chart, you can create a visually appealing and informative representation of your project. Tailoring the chart to your project’s needs enhances readability, understanding, and engagement, ensuring effective communication and project management.
Adding Labels and Descriptions
Adding labels and descriptions to your Gantt chart helps provide clarity and context to the tasks, milestones, and other elements in your project. Labels offer concise information about each item, while descriptions can provide more detailed explanations or notes. By incorporating labels and descriptions, you enhance the understanding and communication of your Gantt chart. Here’s how you can effectively add labels and descriptions:
1. Task Labels: Place labels adjacent to or below each task bar to clearly identify and describe the tasks. Use the text box tool in PowerPoint to add labels, and customize the font, size, and style for better readability. Include a brief but informative description that conveys the purpose or objective of the task.
2. Milestone Labels: Include labels to describe each milestone on your Gantt chart. Position the labels close to or below the milestone indicators. These labels should provide a clear and concise explanation of the milestone’s significance or achievement.
3. Dependency Labels: Add labels to the lines or arrows that represent dependencies between tasks. Label the type of dependency (e.g., FS for finish-to-start) and any additional information. Ensure that the labels are clear and understandable to help viewers easily interpret the relationship between tasks.
4. Description Notes: Introduce description notes or callouts to provide additional details for specific tasks or milestones. Use text boxes or other design elements to display the description notes on the Gantt chart. These notes can explain the scope of the task, provide instructions, or outline dependencies that may not be immediately obvious from the chart.
5. Resource Labels: Consider adding labels to indicate the resources assigned to each task. These labels can be placed next to or below the task labels. Indicating the responsible team member or department helps in efficiently managing resource allocation and clarifies accountability.
6. Legend or Key: Create a legend or key to accompany your Gantt chart. This legend can explain the meaning of color-coding or other visual indicators used in the chart, making it easier for viewers to understand the chart’s conventions.
7. Tooltip Functionality: If you are creating an interactive digital Gantt chart or utilizing project management software, take advantage of tooltip functionality. Tooltips allow you to display additional information when a user hovers over or clicks on a specific task or milestone. Use tooltips to provide more detailed descriptions, progress updates, or other relevant details.
8. Communicate Clearly: Ensure that the labels and descriptions use clear and concise language. Avoid technical jargon or ambiguous terms, aiming for easy comprehension by all stakeholders, including those new to the project or unfamiliar with specific industry terminology.
9. Consistency and Accuracy: Maintain consistency in the format, style, and placement of labels and descriptions throughout the chart. Double-check the accuracy of the information to avoid any misunderstandings or confusion.
10. Regular Review and Updates: Periodically review your chart and update labels and descriptions as needed. Keep track of changes, such as progress updates, task adjustments, or milestone modifications, and reflect them accurately in the chart’s labels and descriptions.
By incorporating labels and descriptions, you enhance the overall understanding of your Gantt chart, ensuring that viewers can easily interpret the tasks, milestones, and dependencies. Clear and concise labeling helps facilitate effective communication and collaboration among project teams and stakeholders.
Formatting the Chart
Formatting your Gantt chart is an essential step in enhancing its visual appeal and readability. Proper formatting improves the chart’s organization and ensures that the information is displayed in a clear and coherent manner. Here are some formatting tips to consider when working on your Gantt chart:
1. Consistent Styling: Establish a consistent styling for your chart. Use the same font type, size, and color throughout the chart to maintain visual harmony. Consistency in styling helps create a professional and cohesive look for your Gantt chart.
2. Clear and Readable Fonts: Choose fonts that are clear, readable, and appropriately sized. Opt for sans-serif fonts, like Arial or Calibri, as they are easy to read on digital screens and in print. Ensure that the font size is large enough to be legible at various zoom levels and viewing distances.
3. Color Coding: Utilize color coding to visually differentiate different elements in your chart. Assign unique colors to task bars, milestones, dependencies, and other elements to provide clarity and make the chart more visually appealing. Choose colors that are easily distinguishable and accessible to individuals with color vision deficiencies.
4. Hierarchy and Indentation: Create a hierarchical structure in your chart by using indentation for subtasks or subcategories. This helps visually organize the tasks and makes it easier to comprehend the project’s structure and breakdown.
5. Whitespace and Alignment: Utilize whitespace strategically to ensure a clean and uncluttered appearance. Leave enough space between tasks, labels, and other chart elements to improve readability. Align the task bars and labels uniformly to maintain a neat and organized layout.
6. Gridlines and Borders: Incorporate gridlines or borders to create a well-defined structure in your chart. Gridlines help align the elements accurately and enable easy identification of task durations. Borders around the chart and its components provide visual separation and enhance the overall presentation.
7. Appropriate Scale: Adjust the scale of the chart’s timeline to display an appropriate level of detail. Avoid overcrowding the chart with too many dates or making it too sparse with too few dates. Find a balance that provides sufficient information without overwhelming the viewers.
8. Chart Size: Ensure that the chart is appropriately sized to fit within the slide or display area. Avoid stretching or compressing the chart, as it can distort the visual proportions. Resize the chart proportionally to maintain its aspect ratio.
9. Consolidate Overlapping Bars: If the duration of some tasks overlaps, adjust the task bars to avoid visual clutter. Consider using stacked or layered bars, or alternative methods such as shaded sections within a single bar, to represent overlapping tasks clearly.
10. Print-Friendly Formatting: If you intend to print the Gantt chart, ensure that the formatting is optimized for print. Check the page layout settings, font sizes, and margins to ensure that the chart prints legibly and accurately.
Regularly review your formatting choices to ensure that they align with your project’s branding and style guidelines. Consider sharing the chart with team members or stakeholders for feedback on its visual clarity and effectiveness.
By applying proper formatting techniques, you can create a visually appealing and well-organized Gantt chart that effectively presents the project’s timeline and tasks.
Adding Relevant Data
Adding relevant data to your Gantt chart provides additional information and context to enhance its usefulness and understanding. By including key project details and metrics, you can create a comprehensive and informative chart that facilitates effective project management and decision-making. Here are some ways to add relevant data to your Gantt chart:
1. Task Descriptions: Include detailed descriptions for each task in your chart. This helps team members understand the purpose and requirements of each task and ensures clear communication and expectations.
2. Assigned Resources: Specify the team members or departments responsible for each task by including resource information. This ensures that roles and responsibilities are clearly defined and helps in efficient resource allocation and workload distribution.
3. Task Durations: Display the estimated duration or time required to complete each task. This provides an understanding of the effort and timeline associated with each activity. Ensure that the durations accurately reflect the project’s requirements and expectations.
4. Estimated Start and End Dates: Add the estimated start and end dates for each task to provide a visual representation of the planned timeline. This helps in understanding the project’s schedule and dependencies. Ensure the dates reflect the project plan and any adjustments made during the planning process.
5. Actual Start and End Dates: If available, include the actual start and end dates for completed tasks or milestones. This allows for easy comparison between planned and actual progress, helping to evaluate project performance and identify any delays or issues.
6. Progress and Completion Status: Indicate the progress or completion status of tasks using visual indicators, such as progress bars or percentage labels. Displaying the progress helps track task advancement, identify bottlenecks, and evaluate project status.
7. Budget and Cost Information: If project budget and costs are relevant, consider adding columns or sections to display budgeted amounts, actual costs, and variances. This provides a comprehensive view of the project’s financial performance and aids in budget management and analysis.
8. Task Dependencies: Clearly represent the task dependencies by indicating the relationship between tasks, such as finish-to-start, start-to-start, finish-to-finish, or start-to-finish. This allows for better understanding of the project’s sequential flow and critical path.
9. Milestone Markers: Provide additional context by including milestone markers that represent significant events or key achievements in the project. Label the milestones to highlight important checkpoints and communicate project progress.
10. Additional Metrics and Performance Indicators: Depending on your project’s requirements and objectives, consider incorporating additional metrics or performance indicators relevant to your specific project. This could include resource utilization rates, project velocity, or other KPIs that align with your project’s goals.
Regularly update and review the data in your Gantt chart to ensure accuracy and relevance as the project progresses. Communication and collaboration with team members and stakeholders are essential to gather and validate the data included in the chart.
By adding relevant data, you transform your Gantt chart into a comprehensive and dynamic project management tool that provides valuable insights into the project’s progress, timeline, resources, and overall performance.
Adding Additional Elements
In addition to the core components, you can enhance your Gantt chart by incorporating additional elements that provide further context and improve its usability. These elements help streamline project management processes, facilitate collaboration, and enhance the visual representation of your project’s timeline and tasks. Here are some elements to consider adding to your Gantt chart:
1. Task Dependencies Legend: Include a legend that explains the different types of task dependencies represented in your Gantt chart. This provides a quick reference for team members and stakeholders to understand the meaning of various dependency symbols or indicators.
2. Resource Allocation Chart: If resource management is critical to your project, consider incorporating a separate chart that displays resource availability, assignments, and utilization. This allows for quick visibility of resource allocation and helps in optimizing resource usage.
3. Project Milestone Table: Create a separate table that lists all project milestones with their corresponding dates and descriptions. This provides a concise overview of key project events and achievements, enhancing the understanding of the project’s progress.
4. Task Priority Indicator: Assign priority levels to tasks and incorporate icons or symbols to indicate their priority status. This allows team members to quickly identify critical tasks and prioritize their efforts accordingly.
5. Risk Assessment and Mitigation: Integrate a section within your chart to highlight identified project risks and their corresponding mitigation strategies. This brings attention to potential obstacles and ensures that risk management is an integral part of project planning and execution.
6. Communication and Collaboration Markers: Incorporate visual markers to identify key communication points or collaboration milestones within the project. This could include meetings, presentations, or deliverable submissions. Indicating these markers on the Gantt chart reinforces the importance of effective communication and collaboration throughout the project lifecycle.
7. Critical Path Highlighting: Use specific formatting or shading to highlight the critical path in your Gantt chart. This visually emphasizes the sequence of tasks that directly impact the project’s completion date. Highlighting the critical path helps in focusing on potential delays and resource constraints.
8. Task Dependencies Timeline: Display a separate timeline or bar chart that depicts task dependencies and how they overlap or align. This provides a visual representation of the interdependencies between tasks, allowing for better understanding and management of their relationships.
9. Performance Metrics Tracking: Create a section or column to track key performance metrics or KPIs relevant to your project. This could include metrics such as budget variance, task completion rate, or milestone achievement rate. Regularly updating these metrics allows for ongoing monitoring and evaluation of the project’s performance.
10. Project Notes or Annotations: Reserve space on your Gantt chart to include project-specific notes, annotations, or reminders. These serve as important references for project-related information or special considerations that need to be communicated and kept in mind during the project’s execution.
Carefully consider the relevance and usefulness of additional elements based on your project’s specific requirements. Continuously review and update these elements to ensure they align with the project’s progress and update stakeholders accordingly.
By incorporating additional elements into your Gantt chart, you can create a comprehensive project management tool that provides a holistic view of the project, aids in decision-making, facilitates collaboration, and enhances overall project understanding.
Exporting and Sharing the Gantt Chart
Once you have created and customized your Gantt chart, it’s important to make it accessible to your project team members and stakeholders. Exporting and sharing your Gantt chart allows for easy collaboration, communication, and tracking of project progress. Here are some methods to export and share your Gantt chart effectively:
1. Save as Image File: Export the Gantt chart as an image file, such as JPEG or PNG. This allows you to easily share the chart via email or messaging platforms. Additionally, you can print the image file for physical distribution or presentation purposes.
2. Export as PDF: Convert your Gantt chart into a PDF file, ensuring that it retains its formatting and visual clarity. PDFs are widely supported and can be easily shared through email, cloud storage, or file sharing platforms. PDFs also allow for easy printing and distribution.
3. Publish on a Project Management Platform: If your organization uses a project management platform, explore options to publish and share your Gantt chart directly on the platform. This enables seamless collaboration and allows team members to view and interact with the chart in real time.
4. Embed in a Presentation or Document: Incorporate the Gantt chart into a presentation or document using presentation software or word processing applications. This allows you to provide additional context and explanations, and ensures that the chart is easily accessible alongside other relevant project information.
5. Share via Online Collaboration Tools: Utilize online collaboration tools to share your Gantt chart with project team members and stakeholders. Platforms like Microsoft Teams, Slack, or Google Drive provide features for sharing files and collaborating in real time, resulting in efficient feedback and discussion.
6. Create a Shared Online Link: Upload your Gantt chart to a cloud storage service or project management platform that allows you to generate a shareable link. This link can be shared with individuals who need access to the chart, enabling them to view and download the file as needed.
7. Present in Meetings or Workshops: Display the Gantt chart in meetings or workshops using a projector or a screen-sharing tool, if applicable. Present the chart in real time and interact with it to discuss project progress, milestones, and task dependencies.
8. Provide Access to the Source File: Share the source file of your Gantt chart (e.g., the PowerPoint or spreadsheet file) with team members or stakeholders who need to make edits or updates. This ensures that individuals have the ability to modify the chart as the project progresses.
Ensure that you consider the privacy and security requirements of your project and organization when sharing the Gantt chart. Apply appropriate access controls and permissions to ensure that only authorized individuals have access to the chart and its underlying data.
By exporting and sharing your Gantt chart, you enhance collaboration, maintain transparency, and foster effective communication among project team members and stakeholders. Choose the method that best fits your project’s needs and ensures that the Gantt chart remains easily accessible and up to date throughout the project lifecycle.
Tips and Best Practices for Creating Gantt Charts in PowerPoint
Creating Gantt charts in PowerPoint can be a powerful way to visually represent project timelines and tasks. To ensure that your Gantt chart effectively communicates project information and facilitates project management, consider the following tips and best practices:
1. Plan and Organize: Before creating a Gantt chart, thoroughly plan and organize your project’s tasks, dependencies, and timelines. A clear understanding of the project scope and objectives will help you structure your Gantt chart effectively.
2. Keep it Simple: Strive for simplicity in your Gantt chart design. Avoid unnecessary clutter or excessive details that may distract from the main purpose of the chart. Keep the visuals clean and straightforward to enhance readability.
3. Use Clear Labels: Ensure that task labels and milestone descriptions are clear, concise, and easy to understand. Use descriptive language that accurately conveys the purpose and scope of each task.
4. Color Coding: Utilize color coding to bring attention to different elements or categories within your Gantt chart. This can include differentiating tasks, indicating progress, or highlighting important milestones. Choose colors wisely to ensure accessibility and meaningful differentiation.
5. Regular Updates: Keep your Gantt chart updated as the project progresses. Update task progress, completion dates, and any changes in dependencies to reflect the most current state of the project. This ensures that the chart remains a reliable reference for team members and stakeholders.
6. Align Task Bars: Align the task bars neatly along the timeline of your Gantt chart. This makes it easier to compare task durations and dependencies visually. Consistency in alignment enhances the clarity and professionalism of your chart.
7. Maintain Proper Scale: Adjust the scale of your Gantt chart’s timeline to strike a balance between detail and readability. Avoid overcrowding the chart with too many dates or making it too sparse. Find a scale that allows for clear visualization of the project timeline and key milestones.
8. Test and Review: Regularly review your Gantt chart with team members and stakeholders to ensure that it accurately represents the project’s scope and progress. Seek feedback to confirm that the chart is understandable and effectively conveys the desired information.
9. Document Assumptions and Constraints: Document any assumptions or constraints that may impact the Gantt chart’s accuracy or the project’s timeline. This helps provide additional context and transparency, ensuring that the chart reflects the project’s reality.
10. Consider Alternative Software: While PowerPoint is a popular choice for creating Gantt charts, consider exploring dedicated project management software or online tools that offer more advanced features and functionality. These tools often provide seamless integration with project data and offer more robust Gantt chart capabilities.
Remember that the Gantt chart is a communication tool, so it’s essential to create it with your audience in mind. Tailor the chart to meet the needs and preferences of your team members and stakeholders, ensuring that it effectively conveys vital project information.
By following these tips and best practices, you can create a professional and informative Gantt chart in PowerPoint that supports effective project management and facilitates clear communication among team members and stakeholders.