
Creating a New Flowchart Document
Flowcharts are an excellent way to visually represent processes and workflows, making it easier to understand complex systems and improve communication. Google Docs offers a convenient platform to create flowcharts, allowing for easy collaboration and access from anywhere with an internet connection.
To create a new flowchart document in Google Docs, follow these simple steps:
- Open Google Docs and click on “Blank” to create a new document.
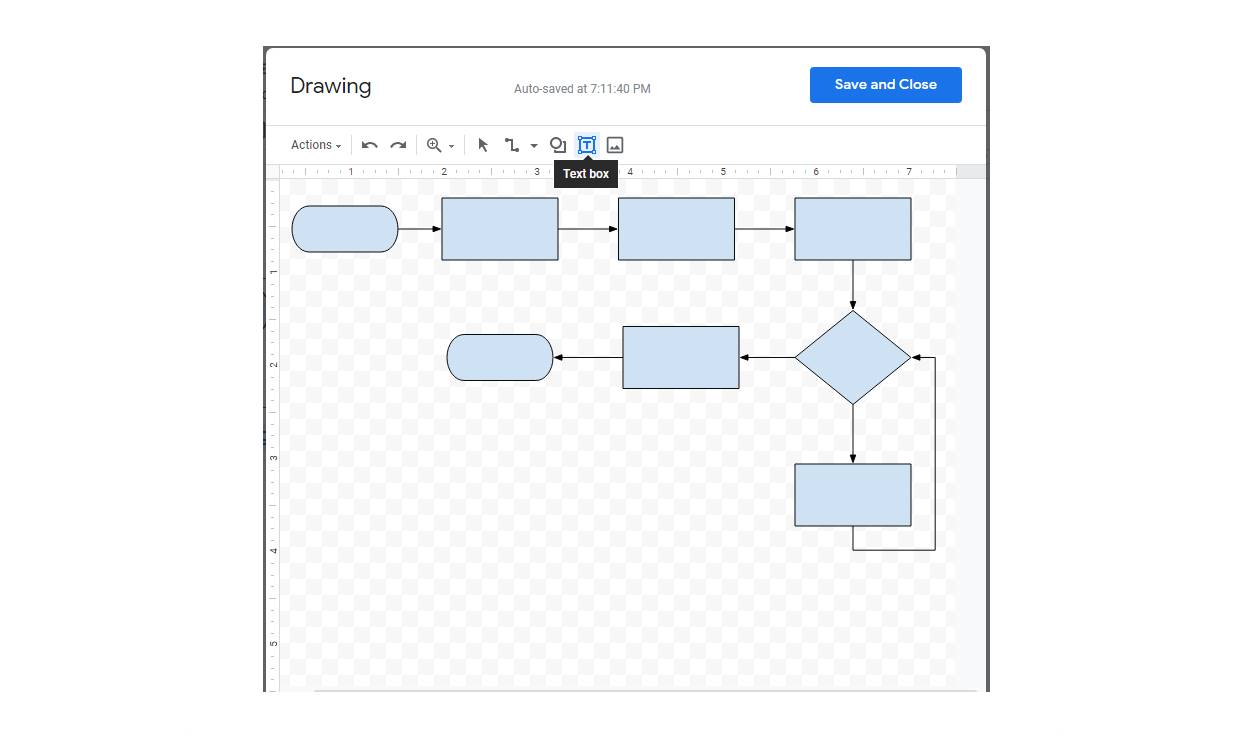
- Click on “Insert” in the menu bar, then select “Drawing”. This will open a new window with the Google Drawing tool.
- In the Google Drawing tool, click on the “Shape” icon in the toolbar to access a wide range of shapes, including rectangles, circles, arrows, and more.
- Select the desired shape and click and drag on the canvas to create it. You can resize and rotate the shape as needed by clicking and dragging the handles around it.
- To add text to a shape, double-click on it and type your desired text. You can also format the text by selecting it and using the formatting options in the toolbar.
- To connect shapes, click on the “Line” icon in the toolbar and select the type of connector you want. Then, click on the first shape and drag the line to the second shape.
- Continue adding shapes, connecting them, and adding text until your flowchart is complete. You can rearrange the shapes by dragging them to different positions on the canvas.
Once your flowchart is ready, you can further customize its appearance by changing the colors, line styles, and adding icons or images. Google Docs provides a range of options to make your flowchart visually appealing and easy to understand.
Remember to save your flowchart regularly to avoid losing any changes. You can access and edit your flowchart anytime by opening the Google Docs document where you created it.
Creating a flowchart in Google Docs is a straightforward process that allows for seamless collaboration and sharing with others. Whether you’re planning a project, illustrating a workflow, or simply organizing information, Google Docs’ flowcharting capabilities make it a versatile tool for any visual representation needs.
Adding and Formatting Shapes
Once you’ve created a new flowchart document in Google Docs, the next step is to add and format shapes. Shapes are the building blocks of your flowchart and help to visually represent different elements and steps in the process.
To add and format shapes in your flowchart, follow these steps:
- In the Google Drawing tool, click on the “Shape” icon in the toolbar.
- A dropdown menu will appear with various shape options such as rectangles, circles, arrows, lines, and more. Select the shape that you want to add.
- Click and drag on the canvas to create the shape. You can resize and reshape it as needed by clicking and dragging the handles.
- To format the shape, right-click on it and select “Format options” from the dropdown menu.
- A sidebar will appear on the right side of the screen, providing a range of formatting options. Here, you can customize the fill color, line color, border width, and more.
- With the shape selected, you can also use the toolbar at the top to format the text within the shape, change the font style, adjust line spacing, and so on.
When adding shapes, make sure to consider the hierarchy and logical flow of your flowchart. For example, start with the main shape representing the start or end point of the process, and then add shapes to represent individual steps or decision points.
To maintain consistency and clarity in your flowchart, try to use consistent colors, shapes, and line styles throughout. This will make it easier for viewers to understand and follow the flowchart.
Remember to save your changes frequently to ensure that your flowchart updates accordingly. You can also collaborate with others in real-time by sharing the Google Docs document with them, allowing for seamless collaboration and feedback.
Adding and formatting shapes in Google Docs’ flowchart feature is a user-friendly process, even for those with minimal graphic design skills. With a wide range of shapes and formatting options available, you can easily create professional-looking flowcharts that effectively communicate your processes and workflows.
Adding Text to Shapes
Text is an essential component of any flowchart, as it provides information and context to the shapes and helps to explain the steps and decision points in the process. Adding text to shapes in Google Docs’ flowchart feature is a straightforward process that allows you to customize the text style and formatting to enhance the readability of your flowchart.
To add text to shapes in your flowchart, follow these steps:
- Double-click on the shape you want to add text to. This will activate the text editing mode for the shape.
- Type the desired text directly into the shape. You can enter multiple lines of text, resize the shape if needed, and the text will automatically wrap within the shape.
- To customize the text style, select the text within the shape and use the formatting options available in the toolbar. You can change the font style, size, color, alignment, and more.
- If you want to add emphasis or highlight specific parts of the text, you can use formatting tools such as bold, italics, underline, or even strikethrough.
- Additionally, you can adjust the line spacing, add bullet points, or create numbered lists for better organization and clarity of information.
It’s important to ensure that the text in your flowchart is concise, clear, and easily readable. Use descriptive labels and avoid using excessive text that may clutter the shapes and make the flowchart confusing.
If you need to make changes or edit the text in a shape, simply double-click the shape again to activate the text editing mode and make the necessary adjustments.
Remember to save your flowchart document regularly to preserve any changes you make to the text or other elements. Sharing the document with others allows for collaboration and feedback, making it easier to refine and improve the flowchart.
Adding text to shapes in Google Docs’ flowchart feature provides the necessary context and explanations for each step in the process, making your flowchart more informative and understandable. With customizable text styles and formatting options, you can create visually appealing flowcharts that effectively communicate your ideas.
Connecting Shapes
Connecting shapes in a flowchart is essential for illustrating the sequence and flow of the process. It helps to visually demonstrate the relationship between different steps or decision points. Google Docs’ flowchart feature allows you to easily connect shapes, creating a seamless and organized flowchart.
To connect shapes in your flowchart, follow these steps:
- In the Google Drawing tool, click on the “Line” icon in the toolbar.
- A dropdown menu will appear with various types of connectors available, such as straight lines, curves, arrows, and more. Select the type of line connector that best suits your flowchart.
- Click on the first shape you want to connect. The line will attach to the shape.
- Drag the line to the second shape you want to connect, and the line will automatically snap to the shape.
- If you need to reposition or adjust the angle of the line, click and drag its endpoints or control points.
- You can continue connecting shapes in this way to create a logical flow of the process.
When connecting shapes, be mindful of the direction and order of the connections. Ensure that the arrows or lines clearly indicate the flow of the process and avoid any confusion for the viewer.
In some cases, you may need to add conditional statements or decision points in your flowchart. To represent these, you can use diamond-shaped symbols and connect them using connectors to illustrate different paths or outcomes.
Remember to save your flowchart document to preserve the connections you’ve made between shapes. By sharing the document, you can collaborate with others and receive valuable feedback on the flowchart’s structure and clarity.
Connecting shapes in Google Docs’ flowchart feature allows for easy visualization of the logical sequence and flow of your process. Effective connections between shapes make the flowchart more comprehensible and facilitate better understanding for the viewers.
Customizing the Appearance of Shapes
A visually appealing flowchart can capture attention and enhance understanding. Google Docs’ flowchart feature provides various options to customize the appearance of shapes, allowing you to create a professional and visually engaging flowchart.
To customize the appearance of shapes in your flowchart, follow these steps:
- Select the shape you want to customize by clicking on it.
- Right-click on the shape and choose “Format options” from the dropdown menu. The sidebar with formatting options will appear on the right side of the screen.
- Under the “Fill color” section, you can choose a desired color for the shape. You can select from solid colors or even use gradient fills to create visually appealing effects.
- Use the “Line color” option to change the color of the shape’s outline. You can choose a color that contrasts well with the fill color to enhance visibility.
- Adjust the “Border width” to make the shape’s outline thicker or thinner, depending on your preference.
- To apply a specific style or pattern to the shape, such as dashed lines or a 3D effect, explore the “Line dash” or “Line style” options.
- If you want to rotate or flip the shape, use the “Rotate” and “Flip” options available in the sidebar.
In addition to these options, you can also customize the appearance of shapes by adding icons or images. You can upload icons or images from your computer or choose from the wide selection of built-in icons and images available in Google Docs.
Remember to experiment with different combinations of colors, line styles, and other formatting settings to find the design that best suits your flowchart and helps convey your message effectively.
By customizing the appearance of shapes, you can create a flowchart that aligns with your branding or visual preferences, making it more visually appealing and engaging for viewers.
Arranging and Aligning Shapes
Arranging and aligning shapes in your flowchart helps create a structured and organized visual representation of the process. With Google Docs’ flowchart feature, you can easily arrange and align shapes to ensure a clear and logical flow.
To arrange and align shapes in your flowchart, follow these steps:
- Select the shapes you want to arrange and align by clicking and dragging your cursor over them or by holding down the Shift key and clicking on each shape individually.
- Right-click on one of the selected shapes and choose “Arrange” from the dropdown menu.
- In the “Arrange” submenu, you will find options such as “Bring to front”, “Bring forward”, “Send backward”, and “Send to back”. Use these options to order the shapes in terms of layering, ensuring that the relevant shapes are in the foreground or background as needed.
- To align shapes, click on the “Align” button in the toolbar. A dropdown menu will appear with alignment options such as left align, center align, right align, top align, middle align, and bottom align.
- Choose the desired alignment option to align the selected shapes accordingly.
- To evenly distribute shapes horizontally or vertically, click on the “Distribute” button in the toolbar. In the dropdown menu that appears, select either “Horizontally” or “Vertically”. This option automatically spaces the selected shapes evenly along the chosen axis.
- If you need to change the spacing between shapes, you can click and drag the handles on the edges of the shapes or use the “Spacing” option in the “Format options” sidebar.
By arranging and aligning shapes, you ensure that your flowchart is visually appealing and easy to follow. Keeping the shapes organized and aligned enhances clarity and helps viewers understand the flow of the process more easily.
Remember to save your flowchart document regularly to preserve the arrangement and alignment of shapes. Sharing the document with collaborators allows for feedback and input on the arrangement, making it easier to refine and improve the flowchart.
With the ability to arrange and align shapes in Google Docs’ flowchart feature, you can create a clear and visually pleasing representation of your process, facilitating better understanding and communication.
Adding Arrows and Connectors
Arrows and connectors are essential elements in flowcharts as they indicate the direction and flow of the process. Google Docs’ flowchart feature provides simple and intuitive tools to add arrows and connectors between shapes, helping to create a clear and interconnected flowchart.
To add arrows and connectors in your flowchart, follow these steps:
- In the Google Drawing tool, click on the “Line” icon in the toolbar.
- A dropdown menu will appear with various types of connectors, including lines with arrows, curves, and more. Select the type of connector that suits your flowchart.
- Click on the first shape where you want to start the connector. The connector will attach to the shape.
- Drag the connector to the second shape, and it will automatically snap and connect to the shape.
- If you need to reposition or adjust the angle of the connector, click and drag its endpoints or control points.
- To add arrows to the connector, right-click on the connector and choose “Add arrow” from the dropdown menu. You can select from various arrow styles to indicate the flow direction.
- Continue adding arrows and connectors as needed to illustrate the process steps and decision points in your flowchart.
When adding arrows and connectors, consider the logical flow and hierarchy of your process. Ensure that the arrows connect shapes in a way that reflects the sequence of the steps or decision outcomes in the flowchart.
Remember to save your flowchart document regularly to preserve the arrows and connectors you’ve added. Sharing the document facilitates collaborative editing and feedback, allowing for improvements to the flowchart’s structure and clarity.
Adding arrows and connectors in Google Docs’ flowchart feature facilitates the understanding of the process flow and ensures that viewers can easily follow the sequence of steps or decision points.
Formatting Text and LinesFormatting text and lines in your flowchart is crucial for creating a visually appealing and professional-looking document. Google Docs’ flowchart feature provides a range of options to format the text and lines, allowing you to customize the appearance of your flowchart.
To format text and lines in your flowchart, follow these steps:
- To format the text within shapes, double-click on the shape to activate the text editing mode.
- Select the text you want to format.
- Use the toolbar at the top to customize the text style, such as changing the font, size, color, and alignment. You can also use formatting options like bold, italics, underline, strikethrough, and subscript/superscript to emphasize or differentiate certain portions of the text.
- To format lines, select the line or connector you want to format.
- Right-click on the line and choose “Format options” from the dropdown menu. The sidebar with formatting options will appear on the right side of the screen.
- In the sidebar, you can change the color of the line, adjust the line weight or thickness, and choose different line styles, including solid, dashed, or dotted lines.
- To format the arrows on connectors, select the connector and right-click to access the formatting options. You can change the style, color, and size of the arrowhead to suit your preferences.
By formatting the text and lines in your flowchart, you can enhance its readability and overall visual appeal. Consistent formatting throughout the document ensures a cohesive and professional look.
Remember to save your flowchart document frequently to preserve any formatting changes you have made. Collaboration with others allows for feedback and input on text and line formatting, enabling you to refine your flowchart further.
Formatting the text and lines in your flowchart using Google Docs’ features allows you to create a polished and visually appealing document that effectively communicates your ideas and processes.
Creating a Legend or Key
When creating a flowchart, especially a complex one, including a legend or key can greatly enhance understanding and clarity. A legend or key serves as a visual guide, providing explanations and interpretations for the various shapes, symbols, and colors used in the flowchart. With Google Docs’ flowchart feature, you can easily create a legend or key to help viewers navigate and comprehend your flowchart.
To create a legend or key for your flowchart, follow these steps:
- On a separate section of your document, create a table with two columns.
- In the first column of the table, list the shapes, symbols, or colors used in your flowchart.
- In the second column, provide a brief description or explanation of each shape, symbol, or color.
- You can format the legend or key to make it stand out, such as using bold text or different cell background colors. This will make it easier for viewers to identify and refer to the legend while analyzing the flowchart.
- Place the legend or key near the flowchart, ideally positioned for easy viewing and referencing.
By including a legend or key, you ensure that viewers clearly understand the meaning and significance of the different elements in your flowchart. It eliminates confusion and aids in the effective interpretation of the depicted process or workflow.
Remember to save your document regularly to preserve the legend or key with your flowchart. Collaborating with others allows for valuable input and feedback on the legend’s comprehensiveness and accuracy.
Creating a legend or key in your flowchart using Google Docs’ features improves the usability and accessibility of the document, allowing viewers to quickly grasp the symbols and colors used throughout the flowchart.
Sharing and Collaborating on Your Flowchart
One of the key advantages of using Google Docs for creating flowcharts is the ability to easily share and collaborate on your documents. With Google Docs’ flowchart feature, you can easily invite others to view, edit, and provide feedback on your flowchart, making it a powerful tool for collaboration.
To share and collaborate on your flowchart, follow these steps:
- Click on the “Share” button in the top right corner of your Google Docs flowchart document.
- In the “Share” dialog box, enter the email addresses of the individuals you want to collaborate with.
- Choose the level of access you want to grant them, such as “Can edit” or “Can comment”.
- Click on “Send” to share the document with the selected collaborators.
Once the document is shared, collaborators can access it using the link provided or by logging in to their Google account.
Collaborators can view and edit the flowchart in real-time, allowing for seamless collaboration and revisions. They can add or modify shapes, adjust the formatting, make comments, or suggest changes using the comments feature in Google Docs.
In addition to real-time collaboration, Google Docs also stores a revision history of your flowchart, making it easy to track and compare changes made by collaborators. You can also restore a previous version if needed.
The commenting feature in Google Docs allows for efficient feedback and discussion. Collaborators can leave comments, ask questions, or provide suggestions directly on the flowchart. You will receive notifications for new comments and can respond to them accordingly.
Remember to save your flowchart document regularly, as changes made by collaborators are automatically saved. This ensures that everyone has access to the most recent version of the flowchart.
Sharing and collaborating on your flowchart using Google Docs’ features streamlines the feedback and revision process. It allows multiple individuals to contribute their expertise, improving the accuracy and refinement of your flowchart.
Printing or Exporting Your Flowchart
Once you have created your flowchart using Google Docs’ flowchart feature, you may want to print or export it for various purposes such as sharing physically, including it in a presentation, or archiving it as a file. Google Docs provides several options for printing or exporting your flowchart to suit your specific needs.
To print or export your flowchart from Google Docs, follow these steps:
- Click on the “File” tab in the top left corner of the Google Docs document.
- In the dropdown menu, scroll down and select either “Print” or “Download”.
- If you choose to print, review the print preview to ensure that the flowchart appears as you want it to on paper. Adjust any print settings such as paper size, orientation, or margins, if needed.
- Click on the “Print” button to print your flowchart.
- If you choose to download, select the desired file format such as PDF, Microsoft Word, or another compatible format.
- After selecting the format, choose the location where you want to save the exported file.
- Click on the “Save” or “Download” button to export and save the flowchart as a file on your device.
Printing your flowchart allows for physical sharing or inclusion in presentations, making it accessible to those who may not have access to the digital version. Exporting as a file gives you the freedom to store and share the flowchart in different formats or transfer it to other platforms.
When printing or exporting, it’s important to consider the scaling and resolution of the flowchart to ensure that it remains legible and visually appealing. Pay attention to the formatting and adjust as necessary to optimize the output for the chosen medium.
By using Google Docs’ printing or exporting options, you can easily obtain a physical or digital copy of your flowchart, allowing for wider distribution and accessibility.