
Enable the Develop Menu in Safari
Safari, the web browser developed by Apple, includes a hidden menu called the Develop menu that provides a range of powerful tools for web developers. By enabling this menu, you gain access to various advanced features that can greatly enhance your web development workflow. Here’s how to enable the Develop menu in Safari:
1. Open Safari on your Mac.
2. Click on the “Safari” menu in the top-left corner of the screen.
3. Select “Preferences” from the dropdown menu.
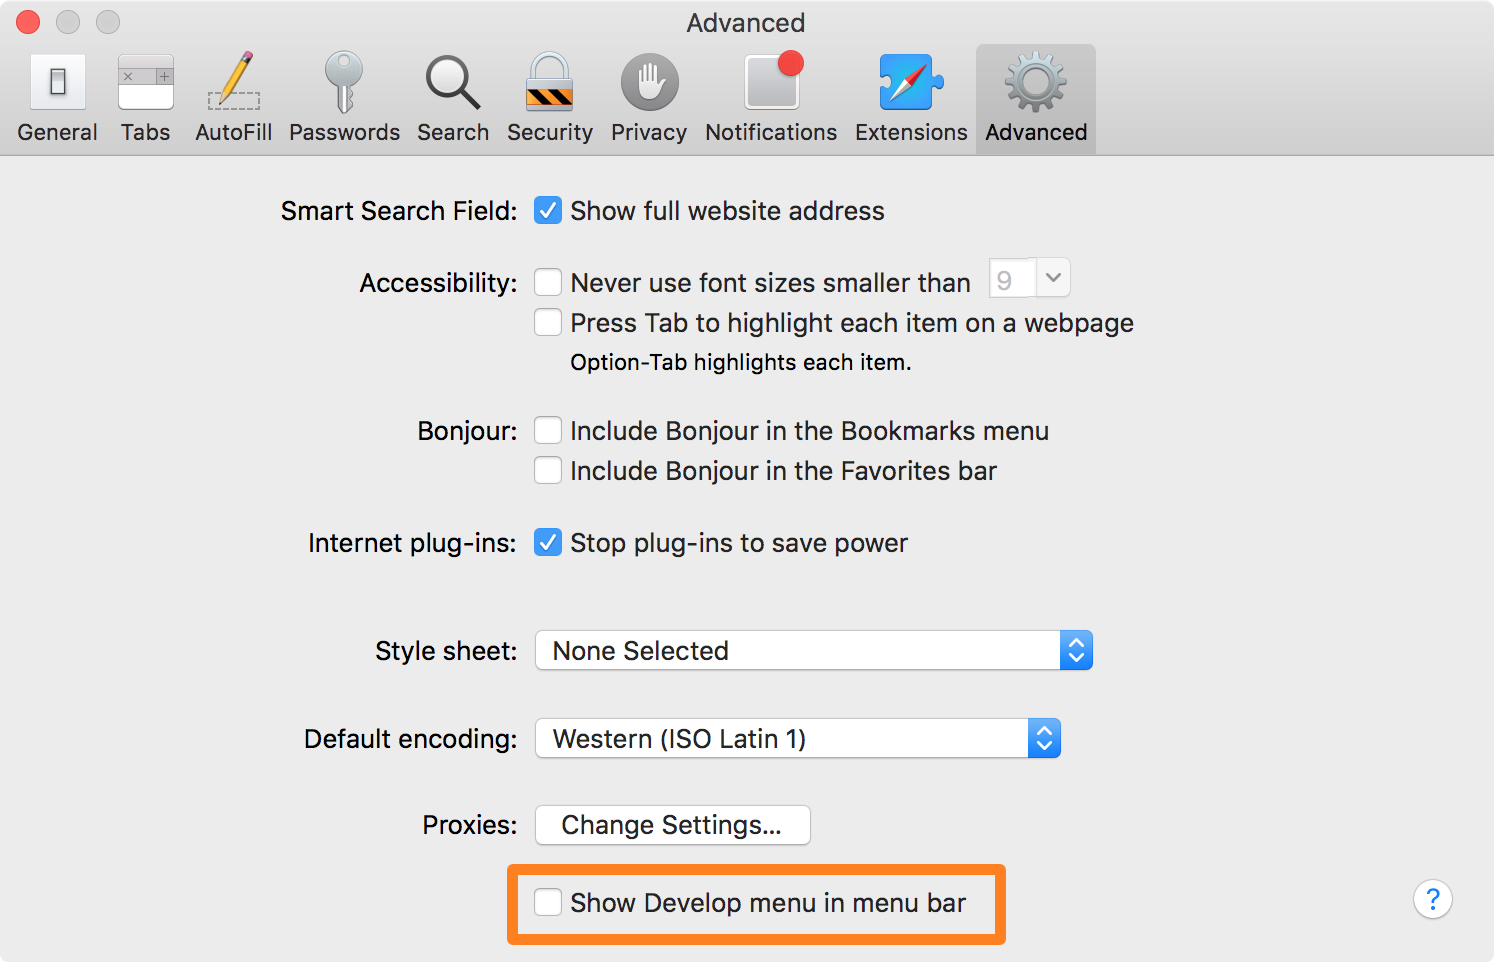
4. Click on the “Advanced” tab in the Preferences window.
5. Check the box next to “Show Develop menu in menu bar.”
6. Close the Preferences window.
Once you’ve followed these steps, you will see a new menu option called “Develop” in the Safari menu bar. This menu provides access to a wide range of development tools and features that can greatly improve your web development process.
Enabling the Develop menu in Safari gives you the ability to inspect and manipulate web pages, debug JavaScript errors, disable caching for better debugging, simulate different network conditions, and much more. This menu is a valuable resource for any web developer looking to optimize their workflow and improve the performance of their websites.
The Develop menu also allows you to customize Safari with extensions specifically designed for web developers. These extensions can provide additional functionality and tools to further streamline your development process.
By enabling the Develop menu in Safari, you unlock a plethora of features and options that can significantly enhance your web development experience. Whether you’re a seasoned developer or just starting out, taking advantage of these tools can help you create better websites with improved performance and accessibility.
Inspect and Manipulate Web Pages with the Web Inspector
The Web Inspector is one of the most valuable tools available in the Safari Develop menu. It allows you to inspect and manipulate the HTML, CSS, and JavaScript of any web page you’re viewing. Here’s how you can use the Web Inspector to enhance your web development workflow:
1. Open the web page you want to inspect in Safari.
2. Go to the Develop menu and select “Show Web Inspector.”
3. The Web Inspector will open in a separate panel at the bottom or side of the Safari window.
With the Web Inspector, you can easily navigate through the HTML structure of a web page and view the CSS styles applied to different elements. You can also modify the CSS styles in real-time to see how they affect the appearance of the page.
Furthermore, the Web Inspector allows you to debug JavaScript code by setting breakpoints, inspecting variables, and stepping through your code line by line. This powerful feature helps you identify and fix any JavaScript errors or issues on your web page.
Another handy functionality of the Web Inspector is the ability to modify the HTML content of a web page on-the-fly. You can make temporary changes to the page to test different design elements or experiment with different scenarios. These changes are not permanent and will revert to the original state upon refreshing the page.
The Web Inspector also provides performance analysis tools that allow you to monitor network requests, resource load times, and memory usage. By analyzing this data, you can identify potential bottlenecks and optimize your website for better performance.
Overall, the Web Inspector is a crucial tool in the web developer’s toolbox. Its ability to inspect and manipulate web pages, debug JavaScript code, and analyze performance makes it an indispensable asset for anyone involved in web development.
Debug JavaScript Errors and Console Messages
JavaScript is a widely-used programming language for creating dynamic and interactive web pages. However, debugging JavaScript code can sometimes be a challenging task. Fortunately, Safari’s Web Inspector provides a powerful toolset for identifying and troubleshooting JavaScript errors. Here’s how you can utilize the Web Inspector to debug JavaScript errors and console messages:
1. Open the web page containing the JavaScript code you want to debug in Safari.
2. Access the Web Inspector by going to the Develop menu and selecting “Show Web Inspector.”
3. Click on the “Console” tab in the Web Inspector panel.
The Console tab in the Web Inspector displays any JavaScript errors, warnings, and log messages that occur on the page. It provides a real-time record of the code execution and helps you identify any issues that may be causing unexpected behavior or errors.
If there are any JavaScript errors on the page, they will be listed in red with a corresponding error message. By clicking on the error message, you can view the exact line of code that triggered the error. This helps you pinpoint the source of the problem and rectify it accordingly.
In addition to errors, the Console also records log messages that you may include in your JavaScript code using the console.log() function. These messages can be helpful for debugging purposes, as they allow you to output specific variable values, check the flow of the code, and track the execution of certain functions.
The Web Inspector also provides a JavaScript debugger tool that allows you to set breakpoints in your code. By placing breakpoints, you can pause the execution of the JavaScript code at specific points and analyze the state of variables, the call stack, and any errors that may occur. This helps you gain deeper insight into the code and identify and fix issues more effectively.
By utilizing the Web Inspector’s Console tab and JavaScript debugger, you can efficiently debug JavaScript errors and console messages. This allows you to enhance the functionality and reliability of your JavaScript code, leading to a smoother and more error-free web development experience.
Disable Browser Caching for Better Debugging
When developing a website or web application, caching can sometimes interfere with your debugging process. Cached files can prevent your browser from loading the latest versions of your web pages and scripts, making it difficult to identify and fix issues. Fortunately, Safari’s Develop menu allows you to disable browser caching temporarily, allowing you to fetch fresh content and debug more effectively. Here’s how:
1. Open Safari and navigate to the web page or application you want to debug.
2. Access the Develop menu and choose “Disable Caches.”
By disabling browser caching, Safari will bypass the stored cache of the web page and retrieve all resources, including HTML, CSS, JavaScript, and images, directly from the server. This ensures that you are always working with the latest version of your files.
With caching disabled, you can analyze the behavior of your website or application in real-time without worrying about outdated files. This is especially useful when troubleshooting issues that may be caused by cached assets.
It’s important to note that disabling caching should only be done during the debugging process. Once you have resolved the issues and completed your debugging tasks, it is recommended to re-enable caching to ensure optimal performance for regular users.
In addition to disabling caching, Safari’s Develop menu also offers options to clear specific caches, like the browser cache, cookies, and local storage. This allows you to remove any stored data that could impact your debugging process and start fresh with each page load.
Disabling browser caching can greatly improve your debugging experience by ensuring that you’re working with the most up-to-date resources on your web page or application. It helps you identify and fix issues more efficiently, leading to a smoother and more reliable user experience for your audience.
Use User Agents to Test Websites on Different Devices
In today’s diverse digital landscape, it is crucial for web developers to ensure that their websites are optimized and responsive across various devices and browsers. Safari’s Develop menu provides a valuable feature that allows you to simulate different user agents, enabling you to test your website’s compatibility on different devices. Here’s how you can utilize user agents to perform device-specific testing in Safari:
1. Open Safari and navigate to the web page you want to test.
2. Access the Develop menu and hover over “User Agent.”
3. A list of different user agents corresponding to various devices and browsers will be displayed.
4. Select the desired user agent that you want to simulate.
By choosing and simulating a specific user agent, Safari adjusts its browser behavior to mimic that of the selected device or browser. This allows you to view and interact with your web page as if you were using that particular device or browser.
Using user agents helps you identify any design or functionality issues that may arise on specific devices or browsers. It allows you to test responsive layouts, CSS media queries, and JavaScript functionality to ensure a seamless user experience across different platforms.
For example, if you select a user agent for an iPhone, Safari will resize the browser window to match the dimensions of an iPhone screen. This enables you to see how your website responds to different screen sizes and orientations, and if any elements are not displaying correctly or becoming unusable on mobile devices.
In addition to testing on different devices, user agents also help you identify if specific browser quirks or differences are affecting your website’s performance or appearance. By simulating different browsers and versions, you can uncover any compatibility issues that may not be evident when testing in your default browser.
By utilizing user agents in Safari, you gain valuable insights into how your website behaves across various devices and browsers. This allows you to make the necessary adjustments to ensure that your website delivers a consistent and optimal user experience, regardless of the platform your audience is using.
Disable JavaScript, CSS, or Images for Performance Testing
Performance is a critical aspect of web development, and it’s essential to ensure that your website or application performs optimally for all users. Safari’s Develop menu provides a helpful feature that allows you to disable JavaScript, CSS, or images temporarily, helping you evaluate the impact of each component on the overall performance of your site. Here’s how you can use this feature to conduct performance testing in Safari:
1. Launch Safari and open the web page or application you want to test.
2. Access the Develop menu and hover over “Disable” to reveal the various options.
3. From the submenu, select either “Disable JavaScript,” “Disable CSS,” or “Disable Images.”
By disabling JavaScript, CSS, or images, Safari removes the corresponding component from the web page or application. This allows you to analyze the performance impact of each element individually.
Disabling JavaScript can help you determine if specific script-heavy functionalities are causing performance issues, such as slow page loading or unresponsive behavior. It allows you to evaluate the core functionality of your site without the execution of any JavaScript code, helping you identify areas for optimization.
Disabling CSS helps you assess how the absence of styles affects the loading time and rendering of your web page. It highlights whether your CSS files are optimized and whether any excessive or unnecessary styles could be impacting performance.
Disabling images allows you to evaluate the impact of image assets on the performance of your site. You can see how removing images affects page loading times and resource usage, enabling you to optimize and prioritize image delivery based on importance and relevance.
By conducting performance testing with disabled JavaScript, CSS, or images, you can identify potential bottlenecks and take steps to optimize the performance of your website or application. It helps ensure that your site loads quickly and efficiently, providing a better user experience for your visitors.
It’s important to note that these disabling options are temporary and should be used solely for performance testing purposes. Once you’ve gathered the necessary data and made the necessary optimizations, remember to enable the disabled components to restore the full functionality and appearance of your site.
Using these performance testing capabilities provided by Safari’s Develop menu empowers you to analyze the impact of specific web components on your site’s performance. It helps you identify and address any areas of improvement, ensuring that your website or application delivers a seamless and efficient user experience.
Simulate Slow Network Conditions for Performance Testing
Network speed plays a significant role in how quickly a website or application loads and performs for users. To ensure optimal performance, it’s crucial to test how your site performs under slow network conditions. Safari’s Develop menu offers a powerful feature that allows you to simulate different network speeds, enabling you to assess and optimize your site’s performance across various network conditions. Here’s how you can utilize this feature to conduct performance testing in Safari:
1. Open Safari and navigate to the web page or application you want to test.
2. Access the Develop menu and hover over “Network Conditions.”
3. From the submenu, select one of the pre-configured network conditions, such as “Slow 3G,” “Fast 3G,” or “Offline.”
By selecting a particular network condition, Safari emulates the network speed associated with that condition. This allows you to see how your site performs under different network constraints.
Simulating slow network conditions helps you identify potential performance bottlenecks and areas for improvement. It allows you to assess how your site handles limited bandwidth, high latency, or other connectivity issues that users might experience in real-world scenarios.
Under slow network conditions, you can observe the impact on page load times, resource loading, and overall responsiveness. This allows you to optimize your site’s use of resources, reduce unnecessary network requests, and streamline its performance.
Additionally, simulating slow network conditions highlights areas where user experience may be affected, such as long loading times, delayed content rendering, or unresponsive interactions. By identifying and addressing these issues, you can create a better user experience on all network connections.
It’s worth noting that the network conditions you simulate using Safari’s Develop menu apply to the current tab or window only, allowing you to isolate and focus on specific parts of your site. This helps you analyze the performance of individual pages or components without affecting other areas of development or browsing.
By utilizing Safari’s network simulation feature, you can gain valuable insights into how your site performs under different network conditions. This knowledge enables you to optimize your site’s performance, ensuring that it delivers a fast, responsive, and reliable user experience across a wide range of network speeds.
Test Accessibility with the Accessibility Inspector
Accessibility is a vital aspect of web development, ensuring that websites and applications are inclusive and usable by people of all abilities. To ensure your site meets accessibility standards, Safari’s Develop menu provides an Accessibility Inspector that allows you to test and analyze your site’s accessibility features. Here’s how you can use this tool to evaluate and improve the accessibility of your website:
1. Open Safari and navigate to the web page you want to test for accessibility.
2. Access the Develop menu and select “Show Accessibility Inspector.”
3. The Accessibility Inspector window will appear, displaying the accessibility properties of the current web page.
With the Accessibility Inspector, you can evaluate various accessibility aspects of your site, including semantic markup, keyboard navigation, color contrast, and more.
For example, the Accessibility Inspector allows you to access the Accessibility Tree, which provides a hierarchical view of the web page’s structure and the accessibility properties of each element. This helps you identify any missing or incorrect semantic markup that may affect screen reader users or users navigating with assistive technologies.
In addition to the Accessibility Tree, the Inspector also features an Accessibility Audit, which highlights any accessibility issues or violations found on the web page. It provides actionable recommendations for improvement, giving you guidance on how to make your site more accessible.
The Accessibility Inspector also allows you to simulate various disabilities and test how your site behaves in those scenarios. For example, you can simulate color blindness, impaired vision, or motor disabilities to ensure that your site remains functional and usable for all users.
By using the Accessibility Inspector, you can proactively test and address accessibility issues, ensuring that your website provides an inclusive and user-friendly experience for all visitors. It helps you identify and correct any barriers that may prevent people with disabilities from accessing and using your site effectively.
Remember, accessibility is an ongoing process, and it’s essential to regularly test and maintain the accessibility of your site as it evolves. The Accessibility Inspector in Safari’s Develop menu is a valuable tool that can help you make your website more accessible, fostering inclusivity and ensuring equal access for all users.
Customize Safari with Extensions for Web Developers
Safari offers a range of extensions that can be installed to enhance its functionality and tailor it specifically to the needs of web developers. These extensions provide powerful tools, shortcuts, and features that can significantly improve your web development workflow. Here’s how you can customize Safari with extensions to boost your productivity:
1. Open Safari and go to the Safari Extensions Gallery.
2. Browse the available extensions or search for specific ones that cater to your needs as a web developer.
3. Once you find an extension that you want to install, click on it to view more details and click the “Install” button to add it to Safari.
There are numerous extensions available that can assist you in various aspects of web development. Some popular ones include:
– Web Developer extension: This extension provides a range of tools for inspecting and manipulating web pages, testing responsiveness, analyzing performance, and more.
– ColorZilla extension: It enables you to sample and analyze colors on web pages, creating a handy color picker tool that aids in design and development tasks.
– Lorem Ipsum Generator extension: This extension generates Lorem Ipsum placeholder text, making it easier for you to mock up content during the development process.
– Wappalyzer extension: It allows you to identify the technologies used on a website, such as content management systems, frameworks, and more, aiding in competitor analysis and site evaluation.
– CSSViewer extension: It provides a simple way to inspect and view CSS styles applied to elements on a web page, assisting you in analyzing and understanding styling choices.
These are just a few examples of the numerous extensions available for Safari. The extensions you choose to install ultimately depend on your specific needs and preferences as a web developer.
Customizing Safari with extensions can streamline your web development process, increase efficiency, and provide access to valuable tools and features right within the browser. Take advantage of these browser enhancements to optimize your workflow and create exceptional websites.
Keep in mind that regularly reviewing and updating your installed extensions is essential, as new and improved extensions are continuously being developed. Stay up to date with the latest offerings to ensure that you have access to the most effective tools for your web development tasks.
Enable Experimental Features and Technologies
Safari’s Develop menu provides an option to enable experimental features and technologies, allowing you to explore and test cutting-edge capabilities before they become mainstream. Enabling these features gives you a glimpse into the future of web development and allows you to stay ahead of the curve. Here’s how you can enable experimental features and technologies in Safari:
1. Open Safari on your Mac.
2. Go to the Safari menu and select “Preferences.”
3. In the Preferences window, click on the “Advanced” tab.
4. Check the box next to “Show Develop menu in menu bar.”
5. Close the Preferences window.
Once you’ve enabled the Develop menu, follow these steps to enable experimental features:
1. Open the web page or application you want to test with experimental features.
2. Access the Develop menu and click on “Experimental Features.”
3. A list of experimental features will be displayed.
4. Check the box next to the feature you want to enable.
Enabling experimental features gives you access to cutting-edge technologies and APIs that are still in development. This allows you to experiment with new functionalities and assess their potential use in your web projects.
Some examples of experimental features include:
– CSS Grid Layout: This modern layout system allows you to create complex grid-based designs with ease, providing more control over the positioning and alignment of elements on a web page.
– WebRTC: This API enables real-time communication, including video and audio streaming, directly between web browsers, allowing you to create interactive and collaborative web applications.
– WebMIDI: This API allows web applications to interact with MIDI devices, enabling musical experiences and applications within the browser.
– Web Bluetooth: This API allows websites to communicate with Bluetooth-enabled devices, opening up new possibilities for IoT (Internet of Things) applications and interactions.
By enabling and experimenting with these features, you can gain firsthand experience and insight into their potential applications. This enables you to adapt and prepare your web development skills for the future.
Keep in mind that experimental features may still be undergoing development, and their implementations can change over time. It’s important to regularly check for updates and ensure that your code remains compatible with evolving standards and best practices.
Enabling experimental features in Safari’s Develop menu allows you to explore new technologies, test upcoming functionalities, and be at the forefront of web development innovation. Embrace the opportunity to experiment and discover exciting possibilities for your web projects.