
Designing a Report in Microsoft Access
Designing a report in Microsoft Access allows you to create polished and professional-looking documents to present and analyze your data. Whether you need to develop a report for financial analysis, project status updates, or inventory management, Access provides the tools and features to easily design and customize reports.
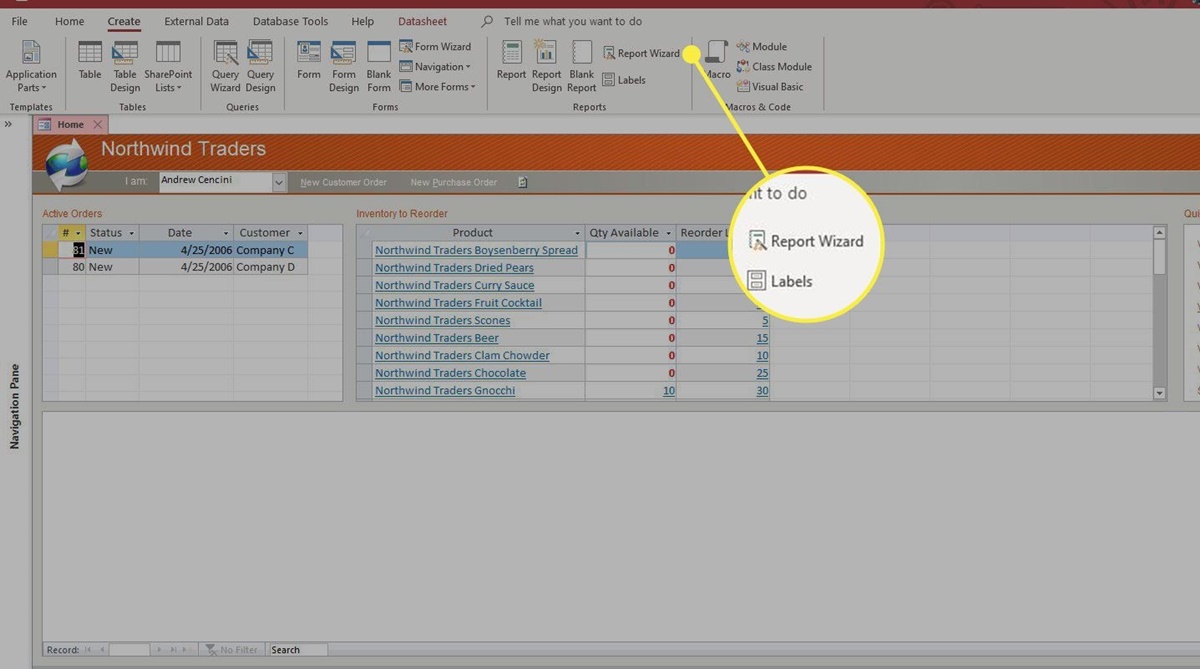
To start designing a report, open your Access database and navigate to the Reports tab. Click on “Create” and select “Report Design” to open the report design view. Here, you’ll find a blank canvas where you can arrange and format your report elements.
First, you need to select the data source for your report. Access allows you to choose from table or query options, giving you the flexibility to extract specific data. Once you’ve selected the appropriate data source, drag and drop the desired fields onto the report design view.
Once your data fields are added, you can customize the layout and design of your report. Access provides a range of tools and features to help you organize and present data effectively. You can group data, apply sorting options, and add calculations and summary totals to provide meaningful insights.
To enhance the visual appeal of your report, you can add labels, text boxes, and images. These elements can be arranged and formatted to provide clear and concise information to the viewer. Access also allows you to apply themes and styles to your report, ensuring consistency across your database.
One of the key features of Access reports is the ability to add subreports to a main report. Subreports allow you to display related information alongside the main report, providing a comprehensive view of the data. This is particularly useful when working with complex datasets or nested relational databases.
Once your report design is complete, you can add page headers and footers to provide additional context or branding. Access also allows you to include page numbers and date/time stamps to ensure the report is easily identifiable and up-to-date.
Finally, when you’re satisfied with your report design, you can print it or export it to various file formats such as PDF or Excel. This allows you to distribute the report digitally or in physical form, depending on your needs.
Designing a report in Microsoft Access is a powerful tool to present and analyze data effectively. By utilizing the various features and options available, you can create professional and visually appealing reports tailored to your specific requirements.
Creating a Simple Report
Creating a simple report in Microsoft Access is a straightforward process that allows you to quickly generate a basic overview of your data. Whether you want to summarize sales figures, display employee information, or showcase product performance, Access provides the necessary tools to create informative and visually appealing reports.
To start creating a simple report, open your Access database and navigate to the Reports tab. Click on “Create” and select “Report Design” to begin the report creation process. In the report design view, you’ll find a blank canvas where you can customize and arrange the layout of your report.
The first step in creating a report is to select the data source. Access offers multiple options, including tables, queries, or even existing reports. Choose the appropriate data source and add the desired fields to your report’s design view.
Once your data fields are added, you can customize the layout and design of your report. Access provides a range of tools and features to help you organize and present data effectively. You can adjust the size and position of fields, change font styles and colors, and apply formatting options such as borders and shading.
To further enhance readability, you can add labels to provide explanations or clarify the purpose of each field. Access also allows you to add title labels to the report itself, giving it a professional and polished look.
Another essential aspect of creating a simple report is the ability to filter and sort data. Using Access’s sorting and filtering options, you can present information in a logical and organized way. This is particularly useful when you have a large dataset and want to focus on specific criteria.
Once you’re satisfied with the design and layout of your report, you can preview it to ensure everything looks as intended. Access provides a preview option that allows you to see how the report will appear when printed or viewed by others.
After previewing the report, you can save it for future use or make additional changes if necessary. Access allows you to modify the report at any time, making it easy to update and maintain your reports as your data evolves.
Creating a simple report in Microsoft Access is an essential task that allows you to present your data in a clear and organized manner. By utilizing the available tools and features, you can generate informative reports that provide valuable insights for your business or personal needs.
Modifying Report Layout and Design
Modifying the layout and design of a report in Microsoft Access gives you the flexibility to customize the visual appearance of your data presentation. Access provides a range of tools and features that allow you to modify the report’s layout, formatting, and styling to meet your specific requirements.
When you are in the report design view, you can easily modify the layout by adjusting the size and position of report controls. By dragging and dropping fields or report controls, you can rearrange the elements to create a more visually appealing and logical display of your data.
In addition to adjusting the layout, Access provides formatting options to enhance the readability of your report. You can change the font styles, sizes, and colors of the text in your report. You can also apply formatting options such as bold, italic, underline, or highlight specific data to draw attention or emphasize important information.
Access offers various border and shading options that allow you to customize the appearance of each report control. By adding borders or shading, you can separate and highlight different sections of the report, making it easier for readers to navigate and understand the information.
Another useful feature in Access is the ability to apply conditional formatting to report controls. This allows you to dynamically change the formatting of specific data based on pre-defined conditions. For example, you can set up a rule to highlight values that exceed a certain threshold or display text in a different color if it meets a specific condition.
To further enhance the visual appeal of your report, you can incorporate images, logos, or graphics. Access provides options to add pictures or icons to your report, allowing you to create a more engaging and professional-looking document.
Grouping and sorting your data is crucial when modifying the layout and design of a report. Access allows you to group data based on specific fields, such as date, region, or category, and display headers and subtotals for each group. This feature helps you organize and present data in a logical and structured manner.
Once you’ve made all the necessary modifications to the layout and design of your report, it’s a good practice to preview the report to ensure everything appears as intended. Access provides a preview mode, allowing you to see how the report will look when printed or viewed by others.
Adding Labels, Textboxes, and Images to a Report
When designing a report in Microsoft Access, you may want to include additional elements such as labels, textboxes, and images to provide more context and enhance the visual appeal of your report. Access provides various options for adding and customizing these elements to create informative and visually appealing reports.
Labels are text elements that you can add to your report to provide explanations, titles, or headings. They can be used to clarify the purpose of specific fields or sections of your report. By adding labels, you can improve the readability and understanding of your report.
To add a label, click on the “Label” control in the Access report design view and then click on the location where you want to place the label. You can then enter the desired text and customize its appearance by changing the font, size, color, and alignment.
Textboxes are another essential element that allows you to display dynamic or calculated data within your report. Textboxes are particularly useful when you need to calculate values, display summary results, or present data from different fields within a single text element.
To add a textbox, click on the “Textbox” control in the Access report design view and then draw a rectangular box on the report canvas. You can then link the textbox to the desired field or calculation by specifying the control source or expression. Customize the appearance of the textbox using formatting options such as font style, size, color, and alignment.
In addition to labels and textboxes, Access allows you to insert images into your report. Images can be used to enhance the visual appeal or provide visual representations of data. For example, you can insert your company logo, product images, or charts and graphs into the report.
To add an image, click on the “Image” control in the Access report design view and then draw a rectangular box on the report canvas. Access provides options to insert images from files, access external data sources, or embed pictures directly into your report. You can resize and position the image within the report to achieve the desired layout.
Once you have added labels, textboxes, and images to your report, it’s important to ensure that they are properly aligned and arranged for a professional and polished look. Access provides alignment and arrangement options that allow you to fine-tune the positioning and spacing of report elements.
By strategically incorporating labels, textboxes, and images, you can create reports that are not only informative but also visually appealing. These elements provide valuable context and enhance the overall presentation of your data.
Formatting Report Controls
Formatting report controls in Microsoft Access allows you to customize the appearance of your data presentation, making it easier to read and understand. Access provides a range of formatting options that allow you to adjust the style, color, size, and alignment of report controls to meet your specific needs.
One of the key formatting options in Access is changing the font style, size, and color of the text within report controls. By selecting the desired control or text box and accessing the formatting options, you can alter the font settings to create a consistent and visually appealing report.
Additionally, Access allows you to apply formatting options such as bold, italic, and underline to specific portions of the text within a control. This feature enables you to highlight important information or emphasize certain data points within your report.
You can also enhance the readability of your report by adjusting the alignment of report controls. Access provides options to align text and data within controls, including left-align, center-align, and right-align. Proper alignment ensures that your data is visually organized and presented in a logical manner.
In addition to font and alignment settings, Access offers formatting options to enhance the visual appearance of your report controls. You can add borders to highlight specific sections or separate different areas within your report. Access also provides shading options to apply backgrounds or fill colors to report controls, which can further enhance readability and improve the overall aesthetics of your report.
Conditional formatting is another powerful feature in Access that allows you to dynamically change the formatting of report controls based on specific conditions. This functionality enables you to highlight data that meets certain criteria, such as values that exceed a threshold or match a specific pattern.
By utilizing the conditional formatting feature, you can draw attention to important information or create visual indicators within your report, improving its usability and effectiveness.
When formatting report controls, it’s essential to maintain consistency throughout your report. Access provides tools to copy and apply formatting settings from one control to another, making it easy to ensure a uniform appearance across your report.
By taking advantage of the available formatting options in Microsoft Access, you can create reports that are visually appealing, easy to read, and effectively convey the information you want to present.
Grouping and Sorting Data in a Report
Grouping and sorting data in a report is crucial for organizing and presenting information in a logical and structured manner. Microsoft Access provides powerful features that allow you to group and sort data to create insightful and user-friendly reports.
When designing a report in Access, you can group data based on specific criteria, such as categories, dates, or regions. Grouping data allows you to create sections within your report that consolidate related data together. For example, if you have a sales report, you can group sales data by month or by salesperson to provide a clearer overview of the data.
To group data in a report, you need to access the report design view and select the field or fields that you want to use for grouping. Access allows you to drag and drop the desired fields into the Report Header or Group Header section, depending on your report layout preferences.
In addition to grouping, Access provides sorting options to arrange data within groups or across the entire report. Sorting data allows you to present information in a specific order, such as alphabetically, numerically, or chronologically. Sorting can be applied to multiple fields, enabling you to organize data based on different criteria simultaneously.
In the report design view, you can access the sorting options and specify the fields and the order in which you want the data to be sorted. Access provides ascending and descending order options, allowing you to sort data in either direction.
Grouping and sorting data not only improve the readability of your report but also provide valuable insights into the data. By consolidating related information together and presenting it in a structured manner, you can identify patterns, trends, and outliers more easily.
Furthermore, Access allows you to add headers and subtotals to each group, providing additional context and summary information. Headers give an overview of the data within each group, while subtotals offer aggregate values such as sum, count, or average for numerical data. These features help readers quickly grasp the key information within each group.
When grouping and sorting data, it’s important to consider the hierarchy and logical flow of information in your report. Access allows you to nest groups within other groups, creating a hierarchical structure that provides a comprehensive view of the data.
Overall, grouping and sorting data in a report using Microsoft Access helps you organize and present information effectively. By using these features, you can create reports that are visually appealing, easy to navigate, and provide valuable insights into your data.
Adding Calculations and Summary Totals
Adding calculations and summary totals to a report in Microsoft Access allows you to derive meaningful insights from your data and provide a comprehensive overview of key metrics. Whether you need to calculate totals, averages, percentages, or perform more complex calculations, Access offers powerful features to help you incorporate these calculations into your reports.
One common use case for calculations in a report is to display summary totals for numeric values. Access provides built-in functions, such as SUM, AVG, COUNT, and MAX/MIN, that allow you to aggregate data and calculate these summary totals. By incorporating these calculations, you can easily determine the total sales, average revenue, or number of units sold, for example, in your report.
To add a calculation to a report, you can use the text box control in the report design view. By specifying the appropriate calculation expression in the control’s Control Source property, Access will automatically calculate the desired values based on the data in your report.
In addition to simple calculations, Access allows you to create more complex expressions using mathematical operators (+, -, *, /), functions, and logical statements. These expressions can be handy in performing calculations such as percentages, ratios, or custom statistical measures.
Another useful feature in Access is calculated controls, which enable you to display the results of calculations directly in your report. By creating a calculated control, you can include the results of your calculations alongside the corresponding data, providing additional insights to the readers of your report.
Access also allows you to perform calculations and aggregations within grouped sections of your report. This is particularly useful when you want to calculate subtotals or create calculations that are specific to each group in your report. These calculations can provide more detailed insights within each section and enhance the understanding of the data.
When adding calculations and summary totals to your report, it’s essential to format and present the results in a clear and easily interpretable manner. Access provides formatting options, such as currency or percentage formatting, to ensure the calculations are properly displayed according to your desired format.
By including calculations and summary totals in your report, you can provide a holistic view of your data and highlight key metrics. These calculations help you analyze and interpret the data more effectively, allowing for better decision-making and deeper insights.
Adding Subreports to a Main Report
Adding subreports to a main report in Microsoft Access allows you to incorporate additional levels of detail and related information within your report. By including subreports, you can create a more comprehensive and insightful report that covers various aspects of your data.
A subreport is a report embedded within another report. It allows you to display data from a different table, query, or report alongside the main report. This is particularly useful when you have related datasets or need to present hierarchical or nested data structures.
To add a subreport to a main report in Access, you need to open the main report in design view and then insert the subreport control from the toolbox. You can then select the appropriate subreport source, whether it is a table, query, or another report, and link it to the main report using common fields or criteria.
By linking the subreport to the main report, you establish the relationship between the two reports, allowing them to share data and display related information side by side. This linkage enables you to create a seamless flow and provide a more comprehensive view of your data.
When designing subreports, you have the flexibility to customize their layout, formatting, and filtering options independently from the main report. You can adjust the size and position of subreport controls, apply different formatting styles, and set unique sorting and filtering criteria to extract the specific data you want to display.
Subreports can be particularly beneficial when working with complex datasets or when presenting data hierarchically. For example, in a sales report, you can have a main report that displays monthly sales figures and includes a subreport for each month. Within each subreport, you can show detailed sales data for individual products or sales representatives.
In addition to displaying related data, subreports can also be used to display summary information or calculated values. You can incorporate aggregate functions like sum, average, or count within the subreport to provide a consolidated view of the data.
By incorporating subreports into your main report, you can create more comprehensive and insightful reports. Subreports allow you to incorporate additional levels of detail, related data, and hierarchical structures, enabling you to present a comprehensive view of your data to your users or stakeholders.
Working with Report Sections
Report sections in Microsoft Access provide a way to organize and structure the content of your reports. By utilizing different sections, you can control how data is displayed, add headers and footers, and customize the layout and formatting of your reports.
Access offers several predefined report sections, including Report Header, Page Header, Group Header, Detail, Group Footer, Page Footer, and Report Footer. Each section serves a specific purpose and allows you to present data in a particular way.
The Report Header section is displayed at the beginning of the report and is typically used to include report titles, logos, and introductory information. It provides an opportunity to set the tone and provide context for the entire report.
The Page Header section is repeated at the top of each page and is useful for including information that should appear on every page, such as headers, page numbers, or date/time stamps.
The Group Header section is used to group and display related data together. It can be utilized to create sections within a report based on specific criteria, such as grouping sales data by territory or department. The Group Header section includes headers for each group and can also contain subtotals or aggregate calculations.
The Detail section is where the bulk of the data is displayed. This section repeats for each record in the data source and contains the actual content of the report. It is the primary section for displaying data rows and can be customized to include relevant fields, labels, and formatting.
The Group Footer section is positioned at the end of each group and provides an opportunity to add additional summary information or calculations specific to each group. It is often used to display group totals or other aggregate data.
The Page Footer section is repeated at the bottom of each page and is useful for including information such as footers, page numbers, or copyright statements.
The Report Footer section is displayed at the end of the report and is typically used to provide overall summary information or additional calculations for the entire report. It allows you to include grand totals or other aggregate data that spans the entire report.
By understanding and utilizing the different report sections, you can customize the layout and structure of your reports to meet specific requirements. Access provides tools and features to adjust the size, formatting, and positioning of each section, allowing you to create visually appealing and organized reports.
Working effectively with report sections enables you to present your data in a clear and logical manner, making it easier for readers to navigate and understand the information presented in the report.
Adding Page Headers and Footers
Adding page headers and footers to a report in Microsoft Access allows you to include consistent information on every page, such as titles, page numbers, and dates. Page headers and footers enhance the professionalism and organization of your reports by providing important contextual information.
The page header section is located at the top of each page and is used to display information that should appear consistently on every page, such as report titles, company logos, or a company slogan. By including these elements in the page header, you ensure that the reader can easily identify the report and its purpose regardless of the page they are viewing.
The page footer section is positioned at the bottom of each page and is useful for including information such as page numbers, dates, or copyright statements. Page numbers help readers navigate through the report and reference specific sections easily. Including the date or other relevant information in the page footer can provide context and make the report more up-to-date.
Access provides options for customizing the content and formatting of page headers and footers. You can choose font styles, sizes, and colors to match the overall design of your report. In addition, you can align the text to the left, center, or right side of the header or footer to ensure that it appears as desired on each page.
Moreover, Access offers advanced features for page headers and footers, such as the ability to create complex expressions or use conditional formatting based on certain criteria. These options allow you to dynamically display different content or formatting depending on specific conditions or values within the report.
It’s important to note that the content of page headers and footers can vary based on the requirements of your report. For example, in multi-page reports, including the report title or chapter title at the top of each page can provide clear navigation and visual cues for readers. On the other hand, for shorter reports or documents with a single page, including only the page number may be sufficient.
By adding page headers and footers to your reports in Access, you create a consistent and professional look and feel. These elements enhance the readability and usability of your reports by providing essential information and enabling readers to navigate through the report with ease.
Adding Page Numbers and Date/Time to a Report
Adding page numbers and date/time to a report in Microsoft Access provides valuable context and enhances the usability of the document. Including page numbers enables readers to navigate through the report easily, while displaying the date/time stamp ensures that the report’s information remains up-to-date.
Page numbers help readers keep track of their location within a report, particularly in multi-page documents. By including page numbers in the header or footer section of each page, readers can easily refer back to specific content, cross-reference information, or follow along with the report’s structure.
To add page numbers to a report in Access, you can utilize the page footer section. Access provides predefined page numbering options that you can include directly in the footer, such as displaying the current page number or the total number of pages. Additionally, you can customize the format of the page numbers to match the overall design of the report.
Another important element to consider in a report is the inclusion of the date and time information. By displaying the date and/or time stamp in the header or footer of each page, you provide readers with critical information about the freshness and relevance of the report’s contents.
Access supports various approaches to adding the date and time to a report. You can choose to display the current date, current time, or both. You can format the date and time to meet specific requirements, such as including the day of the week or different date formats. This flexibility ensures that you can tailor the display of date/time information to suit the needs of your report and audience.
Automatic updating of the date/time stamp is another useful feature in Access. Configuring the report to update the date and time automatically whenever it is opened or printed ensures that the information remains accurate and relevant to the current report instance.
By adding page numbers and date/time to your reports in Microsoft Access, you provide context and make it easier for readers to navigate, reference, and understand the content. These elements enhance the usability and professionalism of your reports, making them more valuable and effective for your audience.
Applying Themes and Styles to a Report
Applying themes and styles to a report in Microsoft Access allows you to quickly and easily change the overall appearance and formatting of your report, giving it a professional and cohesive look. Themes provide a consistent set of colors, fonts, and effects that can be applied to all elements of your report, while styles offer pre-defined combinations of formatting options for specific report elements.
Access offers a variety of built-in themes that allow you to instantly change the visual style of your report. Themes affect all aspects of your report, including fonts, colors, backgrounds, and borders. By applying a theme, you can quickly transform the appearance of your report to match your desired aesthetic or align with your organization’s branding.
In addition to themes, Access provides styles that allow you to format individual report elements, such as headings, footers, labels, or textboxes. Styles consist of a combination of font, color, and other formatting settings, providing a quick and consistent way to format specific parts of your report.
When applying a theme or style, you can preview the changes in real-time to see how they will affect your report. This allows you to experiment with different options and select the one that best suits your needs before finalizing the changes.
Access also allows you to customize themes and styles further to meet your specific requirements. You can modify the colors, fonts, or effects of a theme to create a custom look that aligns with your branding or desired visual design. Additionally, you can create and save your own custom styles, allowing you to reuse them across multiple reports.
Applying consistent themes and styles to your reports not only enhances the overall visual appeal but also improves the readability and professionalism of your documents. By selecting appropriate colors, fonts, and formatting, you can ensure that your reports are visually appealing and easy to read.
Consistency in themes and styles also helps maintain a unified and cohesive look across different sections and elements of your report, providing a polished and professional impression to your readers.
Utilizing the themes and styles functionality in Microsoft Access allows you to easily and efficiently create visually appealing reports that effectively convey the information you intend to present.
Printing and Exporting Reports
Printing and exporting reports in Microsoft Access allow you to share your reports with others or preserve them in various file formats for future reference or distribution. Access offers flexible options to print reports directly or export them to different formats, making it convenient to share and access your report content.
When it comes to printing reports, Access provides a straightforward process that allows you to preview and customize the print settings before sending it to a printer. You can adjust the page orientation, paper size, margins, and zoom level to ensure that your report is printed exactly as desired.
Additionally, Access offers print options to control which pages of the report are printed, allowing you to print specific sections, selected pages, or the entire report. This flexibility ensures that you can focus on the most relevant information or print multiple copies as needed.
For digital distribution or preservation, exporting reports to different formats is a valuable feature in Access. You can export reports to popular formats such as PDF, Excel, Word, or HTML. This allows you to share the report electronically with others who may not have Access installed or to archive the report in a format that can be easily accessed and viewed.
Exporting reports to PDF is particularly useful as it preserves the formatting and layout of the report, ensuring that it looks the same regardless of the device or operating system used to view it. PDF files can be easily shared via email or uploaded to online platforms for wider accessibility.
Exporting reports to Excel or Word can be beneficial when you need to further analyze or manipulate the report data. These formats allow you to work with the report content in a spreadsheet or document format, enabling advanced calculations, filtering, or formatting options.
The option to export reports to HTML provides the ability to publish the report on a website or intranet, allowing others to view the report directly from a web browser. This format is useful when you need to make the report accessible to a broader audience or embed it within other web-based content.
By offering both printing and exporting options, Microsoft Access enables you to easily share and distribute your reports in a format that suits your specific needs. Whether you prefer a physical copy or a digital file, Access provides the necessary tools to generate reports in various formats and make them accessible to others.