
What is the iPhone Debug Console or Web Inspector?
The iPhone Debug Console and Web Inspector are powerful tools that allow developers to inspect and debug web pages on the Safari browser or websites viewed through other apps on the iPhone. These tools provide valuable insights into the structure, behavior, and performance of web pages, helping developers identify and fix issues that affect the user experience.
The Debug Console is a built-in feature in Safari that enables developers to view and interact with error messages, log messages, and JavaScript code execution. It provides a real-time look into the underlying code of a web page, offering developers a better understanding of how everything is functioning. This is especially helpful when trying to identify errors or issues that may be affecting the functionality of a website or web app.
The Web Inspector, on the other hand, provides a more advanced set of debugging tools. It allows developers to analyze and modify various aspects of a web page, such as HTML elements, CSS styles, and JavaScript behavior. Developers can use the Web Inspector to inspect network requests, examine the document structure, measure performance metrics, debug JavaScript code, and more.
Both the Debug Console and Web Inspector are indispensable tools for web developers who want to ensure their websites or web apps are running smoothly on iOS devices. The ability to inspect and debug web pages directly on the iPhone provides a convenient and efficient way to identify and resolve issues without the need for additional hardware or software.
Now that we have a basic understanding of what the iPhone Debug Console and Web Inspector are, let’s explore how to enable and use them on your iPhone.
Enabling Debug Console on iPhone
The Debug Console on iPhone is a handy feature that allows you to view error messages, log messages, and execute JavaScript code. Enabling the Debug Console is relatively straightforward, and you can do it through the Safari browser. Here’s how:
- Open the Settings app on your iPhone.
- Scroll down and tap on “Safari”.
- Scroll down again and tap on “Advanced”.
- Toggle the “Web Inspector” switch to enable it. This will enable the Debug Console as well.
Once you have enabled the Debug Console, you can access it by opening Safari on your iPhone and navigating to the web page or web app you want to debug. To open the Debug Console, follow these steps:
- Open Safari on your iPhone.
- Navigate to the web page or web app you want to debug.
- Long-press the “Refresh” button on the Safari toolbar.
- A menu will appear – tap on “Show Web Inspector”.
The Debug Console will appear at the bottom of the screen, displaying any error messages or log messages generated by the web page. You can also execute JavaScript code directly in the console to test and debug specific functionalities.
With the Debug Console enabled on your iPhone, you have a powerful tool at your disposal to identify and resolve any issues or errors affecting the performance of your web pages or web apps.
Steps to Enable Debug Console on iPhone through Safari
If you prefer to use the Safari browser on your iPhone to enable the Debug Console, you can follow these steps:
- Open the Safari app on your iPhone.
- Tap the “Tabs” icon located at the bottom-right corner of the screen to view your open tabs.
- Tap the “Private” button at the bottom-left corner of the screen to switch to private browsing mode. This step is essential for enabling the Debug Console in Safari.
- In the private browsing mode, tap the “plus” button at the bottom-center of the screen to open a new tab.
- Enter “about:config” in the address bar and tap “Go”.
- A warning message will appear, informing you that you are about to enter a configuration page. Tap “Continue” to proceed.
- In the configuration page, tap the search bar at the top and type “debug”.
- Locate the “debug console.enabled” option and tap the toggle switch to enable it. This will activate the Debug Console in Safari.
- Close the tab with the configuration page by tapping the “x” icon at the top-left corner of the screen.
- You can now exit private browsing mode by tapping the “Private” button at the bottom-left corner once again.
Once you have completed these steps, the Debug Console will be enabled in Safari on your iPhone. You can access it by opening a web page or web app and following the instructions mentioned in the previous section.
Enabling the Debug Console through Safari provides an alternative method to access this powerful debugging tool on your iPhone, giving you even more flexibility and convenience in your web development workflow.
Steps to Enable Debug Console on iPhone through Chrome
If you prefer to use the Chrome browser on your iPhone to enable the Debug Console, you can follow these steps:
- Open the Chrome app on your iPhone.
- Tap the three dots menu icon located at the bottom-right corner of the screen to open the menu.
- Scroll down and tap “Settings” to access the Chrome settings.
- Tap “Privacy” in the settings menu.
- Tap “Clear Browsing Data”.
- In the next screen, make sure the “Cookies, Site Data” option is enabled and tap “Clear Browsing Data” again.
- Tap the back arrow to return to the Privacy settings.
- Tap “Content Settings”.
- Tap “JavaScript” to access JavaScript settings.
- Toggle the “Blocked” switch to disable JavaScript blocking. This step is necessary to enable the Debug Console in Chrome.
- Exit the Chrome settings by tapping the back arrow to return to the browser.
Once you have completed these steps, the Debug Console will be enabled in Chrome on your iPhone. You can access it by opening a web page or web app and following the instructions mentioned earlier in this article under the section “Using Debug Console on iPhone”.
Enabling the Debug Console through Chrome provides an alternative option for developers who prefer using Chrome as their primary browser. It offers similar functionality and debugging capabilities as the Debug Console in Safari, allowing you to effectively diagnose and debug any issues in your web pages or web apps.
Using Debug Console on iPhone
The Debug Console on iPhone provides valuable insights into the behavior and performance of web pages, allowing developers to diagnose and fix issues. Once you have enabled the Debug Console on your iPhone, you can follow these guidelines to make the most of its capabilities:
- Open Safari on your iPhone and navigate to the web page or web app you want to debug.
- Long-press the “Refresh” button on the Safari toolbar.
- A menu will appear – tap on “Show Web Inspector”.
- The Debug Console will appear at the bottom of the screen, displaying any error messages or log messages generated by the web page.
- You can use the console to execute JavaScript code directly. Simply type your code in the console and press Enter to see the results.
- Inspect the network requests made by the web page by navigating to the “Network” tab in the Debug Console. Here, you can view details such as request/response headers, status codes, and timing information.
- Examine the document structure of the web page by navigating to the “Elements” tab. Here, you can inspect and modify HTML elements, CSS styles, and DOM properties.
- Debug JavaScript code using the “Sources” tab. You can set breakpoints, step through code execution, and view variable values to identify and resolve any issues.
- Utilize other features in the Debug Console, such as the “Console” tab for logging messages or the “Storage” tab for inspecting cookies and other storage data.
The Debug Console provides a comprehensive set of tools that can help you diagnose and troubleshoot any issues with your web pages or web apps directly on your iPhone. By effectively utilizing these debugging capabilities, you can ensure a smooth and optimized user experience.
Understanding the Web Inspector on iPhone
The Web Inspector is a powerful tool available on the iPhone that offers advanced debugging capabilities for web pages and web apps. By gaining a clearer understanding of how the Web Inspector works, developers can effectively analyze and optimize the performance of their websites. Here’s what you need to know:
The Web Inspector provides a comprehensive view of the structure and behavior of a web page, allowing developers to inspect and modify various elements such as HTML, CSS, and JavaScript in real-time. It offers a range of features and panels that provide insights into the different aspects of a web page, including network traffic, DOM structure, JavaScript execution, and more.
With the Web Inspector, developers can analyze and optimize the network performance of their web pages. They can inspect network requests, examine request and response headers, analyze loading times, and identify any bottlenecks or issues affecting the overall performance.
In addition, the Web Inspector allows developers to debug and troubleshoot JavaScript code on a web page. They can set breakpoints, step through code, monitor variable values, and detect errors or issues that may affect the functionality.
Inspecting and modifying the DOM structure and CSS styles is another key functionality of the Web Inspector. Developers can interactively explore and manipulate the HTML elements, adjust CSS properties, and see the changes in real-time. This provides a powerful way to experiment with different designs and layouts.
The Web Inspector also includes a timeline panel that records and visualizes performance metrics, such as CPU usage, memory usage, paint times, and more. This allows developers to identify any performance bottlenecks and make optimizations to enhance the overall user experience.
By utilizing the various features and panels offered by the Web Inspector, developers can gain deeper insights into the inner workings of their web pages and troubleshoot any issues that may arise. It provides an invaluable toolset to optimize and improve the performance of websites and web apps on the iPhone.
Enabling Web Inspector on iPhone
The Web Inspector is a powerful tool that allows developers to debug and optimize web pages on the iPhone. Enabling the Web Inspector is a straightforward process, and it can be done through the Safari browser. Here are the steps to enable the Web Inspector on your iPhone:
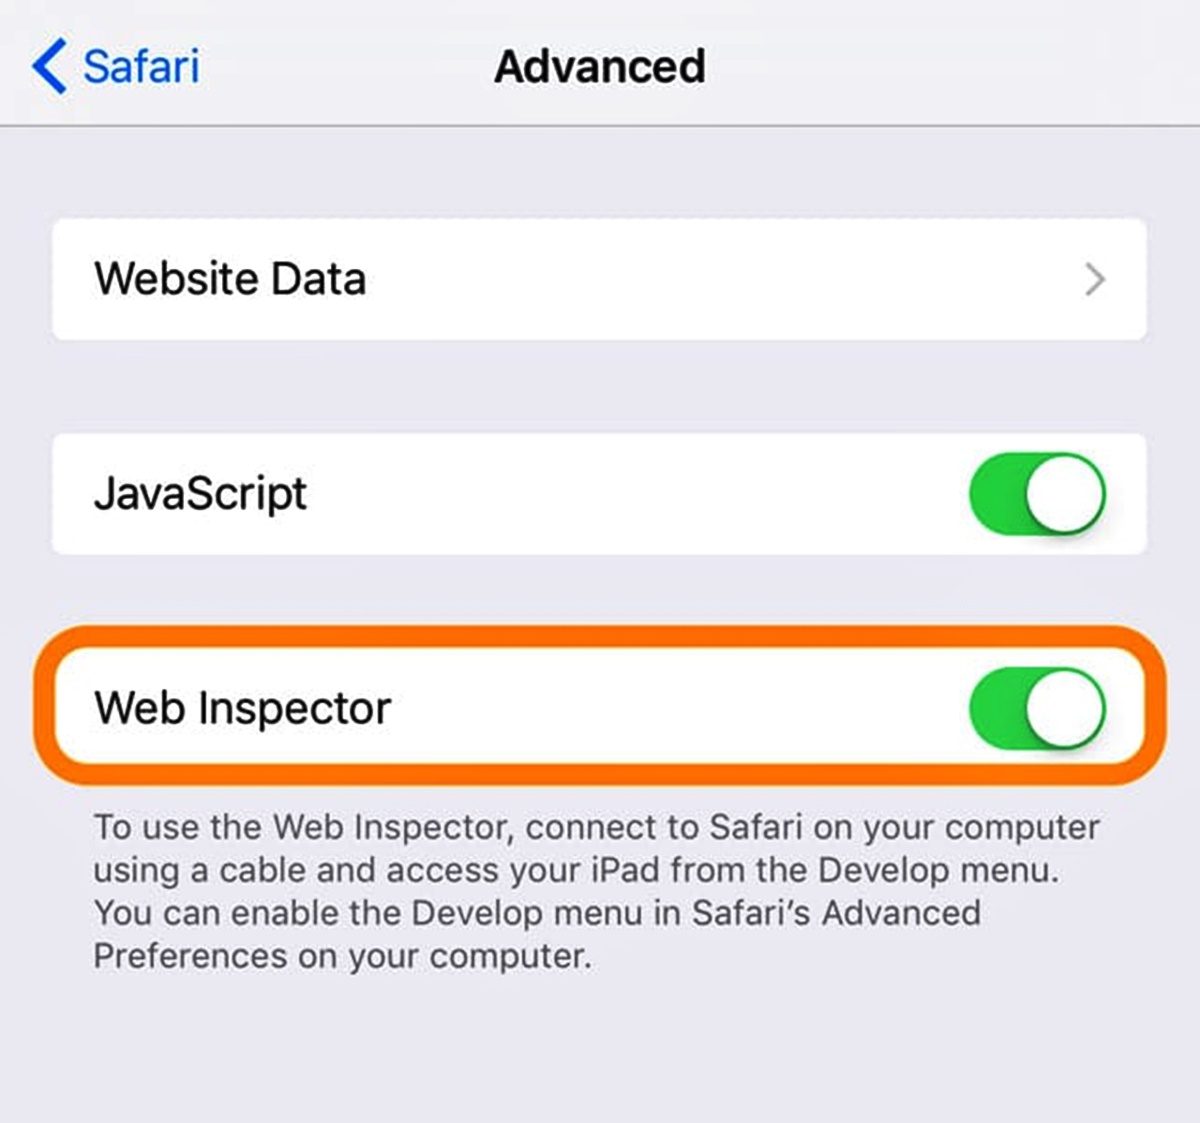
- Open the Settings app on your iPhone.
- Scroll down and tap on “Safari”.
- Scroll down again and tap on “Advanced”.
- Toggle the “Web Inspector” switch to enable it. This will activate the Web Inspector feature in Safari.
Once you have enabled the Web Inspector, you can access it by opening Safari on your iPhone and navigating to the web page or web app you want to inspect and debug.
It’s important to note that the Web Inspector can also be enabled for other browsers on the iPhone, such as Chrome. However, the steps to enable it may vary depending on the browser you are using. Ensure that you have the latest version of the browser installed and explore the browser settings to find the option to enable the Web Inspector if it is not readily visible.
Enabling the Web Inspector provides developers with a powerful toolset to analyze and optimize the structure, behavior, and performance of web pages on their iPhone. By utilizing this feature, developers can identify and fix issues, enhance the user experience, and ensure their websites or web apps are running smoothly on iOS devices.
Steps to Enable Web Inspector on iPhone through Safari
If you prefer to use the Safari browser on your iPhone to enable the Web Inspector, you can follow these steps:
- Open the Settings app on your iPhone.
- Scroll down and tap on “Safari”.
- Scroll down again and tap on “Advanced”.
- Toggle the “Web Inspector” switch to enable it. This will activate the Web Inspector feature in Safari.
Once you have enabled the Web Inspector, you can access it by following these steps:
- Open Safari on your iPhone.
- Navigate to the web page or web app you want to inspect and debug.
- Connect your iPhone to a Mac computer using a USB cable.
- Launch Safari on your Mac computer.
- In the Safari menu, click on “Develop”.
- You should see your iPhone listed in the dropdown menu. Hover over it.
- A submenu will appear – click on the name of your iPhone.
- The Web Inspector window will open on your Mac computer, displaying the web page or web app running on your iPhone.
Now, you have successfully enabled the Web Inspector on your iPhone and connected it to Safari on your Mac computer. You can use the powerful debugging tools offered by the Web Inspector to analyze and optimize the web page or web app.
It’s worth noting that this method requires a Mac computer with Safari installed. If you don’t have access to a Mac, you can use alternative methods like the one mentioned earlier in enabling the Web Inspector through the Safari settings directly on your iPhone.
By enabling the Web Inspector through Safari, developers have a convenient way to inspect and debug their web pages or web apps directly on the iPhone, offering more comprehensive control and optimization options.
Steps to Enable Web Inspector on iPhone through Chrome
If you prefer to use the Chrome browser on your iPhone to enable the Web Inspector, you can follow these steps:
- Open the Chrome app on your iPhone.
- Tap the three dots menu icon located at the bottom-right corner of the screen to open the menu.
- Scroll down and tap “Settings” to access the Chrome settings.
- Scroll down again and tap “Developer Tools”.
- Toggle the “Enable Developer Tools” switch to enable it. This will activate the Web Inspector feature in Chrome.
- Exit the Chrome settings by tapping the back arrow to return to the browser.
With the Web Inspector enabled in Chrome, you can now access it by following these steps:
- Open Chrome on your iPhone.
- Navigate to the web page or web app you want to inspect and debug.
- Tap the address bar at the top of the screen and enter “chrome://inspect” as the URL.
- Tap the “Enter” or “Go” button on the keyboard.
- You will see a list of devices and web pages that are available for inspection. Tap on the desired web page to open the Web Inspector.
Now, you have successfully enabled the Web Inspector in Chrome on your iPhone and opened it for the web page or web app you want to inspect and debug. You can utilize the various tools and features provided by the Web Inspector to analyze and optimize the performance of the web page.
Enabling the Web Inspector through Chrome provides developers with an alternative option for inspecting and debugging web pages or web apps on their iPhone. It offers a set of powerful tools to assist in identifying and fixing potential issues, enhancing the user experience, and ensuring optimal performance on iOS devices.
Using Web Inspector on iPhone
The Web Inspector on iPhone is a powerful tool that allows developers to analyze and optimize web pages and web apps. Once you have enabled the Web Inspector, you can follow these guidelines to make the most of its capabilities:
- Open Safari or Chrome on your iPhone and navigate to the web page or web app you want to inspect and debug.
- If using Safari, connect your iPhone to a Mac computer using a USB cable and open Safari on your Mac.
- If using Chrome, ensure that you have enabled the Web Inspector in Chrome settings on your iPhone.
- In Safari on your Mac or Chrome on your iPhone, launch the Web Inspector by following the steps mentioned in the previous section.
- Once the Web Inspector opens, you will have access to various panels and features that allow you to analyze different aspects of the web page or web app.
- Use the Elements panel to inspect and modify the HTML structure of the page. You can select and highlight elements, add or remove attributes, and experiment with CSS styles.
- Utilize the Network panel to monitor and evaluate network requests made by the web page. You can view request and response details, analyze loading times, and identify any performance issues.
- Use the Console panel to test and debug JavaScript code. You can execute JavaScript commands, log messages, and view any error or warning messages generated by the web page.
- The Sources panel allows you to debug JavaScript code further. You can set breakpoints, step through code execution, inspect variables, and analyze the flow of your code.
- Take advantage of other panels such as Timeline, Performance, and Storage, depending on your specific debugging and optimization needs.
- Experiment with the available features and tools to identify and resolve any issues or bottlenecks affecting the performance and functionality of the web page or web app.
By effectively using the Web Inspector on your iPhone, you can gain deeper insights into the inner workings of your web pages and web apps. This provides an invaluable toolset for debugging, optimizing, and enhancing the overall user experience.
Troubleshooting Tips for Debug Console or Web Inspector
While the Debug Console and Web Inspector are powerful tools for web development on the iPhone, there may be occasions when you encounter issues or face challenges. Here are some troubleshooting tips to help you overcome common problems and make the most of these debugging tools:
- Verify Compatibility: Ensure that your iPhone is using a compatible version of the operating system and that you have the latest updates installed. Some features of the Debug Console or Web Inspector may require specific iOS versions.
- Clear Cache and Cookies: Clearing the cache and cookies in the browser can help resolve issues related to loading or displaying web pages. Go to the settings of your browser (Safari or Chrome) and find the option to clear browsing data.
- Check Connection: When using the Web Inspector on Safari, make sure your iPhone is properly connected to your Mac computer via a USB cable. Ensure that the necessary permissions are granted and that the connection is stable.
- Restart Devices: Sometimes, a simple restart of your iPhone or Mac can resolve temporary glitches or conflicts that may be impacting the functionality of the Debug Console or Web Inspector.
- Disable Browser Extensions: If you are experiencing issues with the Web Inspector, try disabling any browser extensions or plugins that could potentially interfere with its functionality.
- Use Browser Compatibility: While the Debug Console and Web Inspector are primarily designed for Safari, it’s worth noting that certain debugging features may not be fully supported in other browsers like Chrome. Switch to Safari if you encounter specific compatibility issues.
- Review Console Messages: Take the time to carefully read and analyze any error messages or log messages displayed in the Debug Console. Often, they can provide valuable clues about the source of the problem.
- Inspect Code and Network Requests: Use the Web Inspector to examine the code, network requests, and console output of your web page or web app. Look for any errors, warnings, or unusual behavior that may indicate the root cause of the issue.
- Debug in Segments: When troubleshooting complex issues, consider breaking down the problem into smaller segments and testing each component individually. This approach can help isolate and identify specific areas that require attention.
- Consult Documentation and Resources: Don’t hesitate to consult official documentation, online forums, or developer communities for assistance. Chances are that others have encountered similar issues and may have shared their solutions.
By employing these troubleshooting tips, you can overcome common challenges and effectively utilize the Debug Console and Web Inspector to resolve issues, optimize performance, and ensure a seamless user experience for your web pages or web apps on the iPhone.