
Understanding Regression Analysis
Regression analysis is a statistical technique that aims to uncover the relationship between a dependent variable and one or more independent variables. It is commonly used in various fields, such as economics, finance, social sciences, and marketing, to analyze and predict outcomes based on past data.
At its core, regression analysis seeks to find the best-fitting line or curve that represents the relationship between the variables. The dependent variable, also known as the outcome variable, is the one you want to predict or explain. The independent variables, also known as predictor variables, are the factors that may influence or contribute to the variation in the dependent variable.
There are two main types of regression analysis: simple regression and multiple regression. Simple regression involves only one independent variable, while multiple regression involves two or more independent variables. For example, if you want to predict a person’s salary based on their years of experience, you would use simple regression. If you want to predict a person’s salary based on their years of experience, education level, and age, you would use multiple regression.
The output of a regression analysis provides valuable information about the relationship between the variables. It includes the coefficients, which quantify the strength and direction of the relationship, as well as the p-values, which indicate the statistical significance of the coefficients. A low p-value suggests that the coefficient is significantly different from zero, implying that it has a strong impact on the dependent variable.
Regression analysis is a powerful tool for understanding and predicting relationships between variables. It allows you to identify the factors that drive changes in the dependent variable and assess the significance of these factors. By analyzing the regression output and conducting further tests, you can gain valuable insights into the underlying dynamics of the data and make informed decisions based on the findings.
Setting up Your Data
Before running a regression analysis in Excel, it is crucial to properly set up your data. The organization and formatting of your data will directly impact the accuracy and reliability of the regression results. Here are some important steps to follow:
- Collect and clean your data: Start by gathering the data for your dependent variable and independent variables. Ensure that the data is accurate, complete, and free from errors. Remove any outliers or incorrect observations that may distort the analysis.
- Arrange your data in columns: It is recommended to have each variable in a separate column. Put your dependent variable in one column and each independent variable in subsequent columns. Ensure that the order of the columns corresponds to the order in which you want to include the variables in the regression analysis.
- Label your variables: Assign meaningful labels to your variables. Use clear and concise names that describe the nature of each variable. This will help you easily identify and interpret the results later on.
- Check for missing data: Examine your data for any missing values. If you encounter missing data, decide how to handle them. You can either delete the observations with missing values, replace the missing values with a placeholder (e.g., average value), or use specialized techniques for imputing missing data.
- Ensure consistency in data format: Ensure that the data in each column has a consistent format. For example, if one column represents dates, make sure all entries are in the same date format. Inconsistent formatting may lead to errors or misinterpretation of the results.
- Consider scaling your variables: Depending on the nature of your independent variables, it may be beneficial to scale or standardize them. This can help avoid issues related to different units or magnitudes of the variables. Scaling can be done by subtracting the mean and dividing by the standard deviation of each variable.
By following these steps and ensuring the proper setup of your data, you can minimize potential errors and achieve more accurate regression results. Remember that data preparation is a critical component of any regression analysis, and investing time and effort in this stage will greatly contribute to the success and reliability of your analysis.
Running the Regression Analysis
Once you have prepared and organized your data, you are ready to run the regression analysis in Excel. Excel provides a user-friendly interface that makes it accessible for both beginners and advanced users. Here’s how you can run a regression analysis:
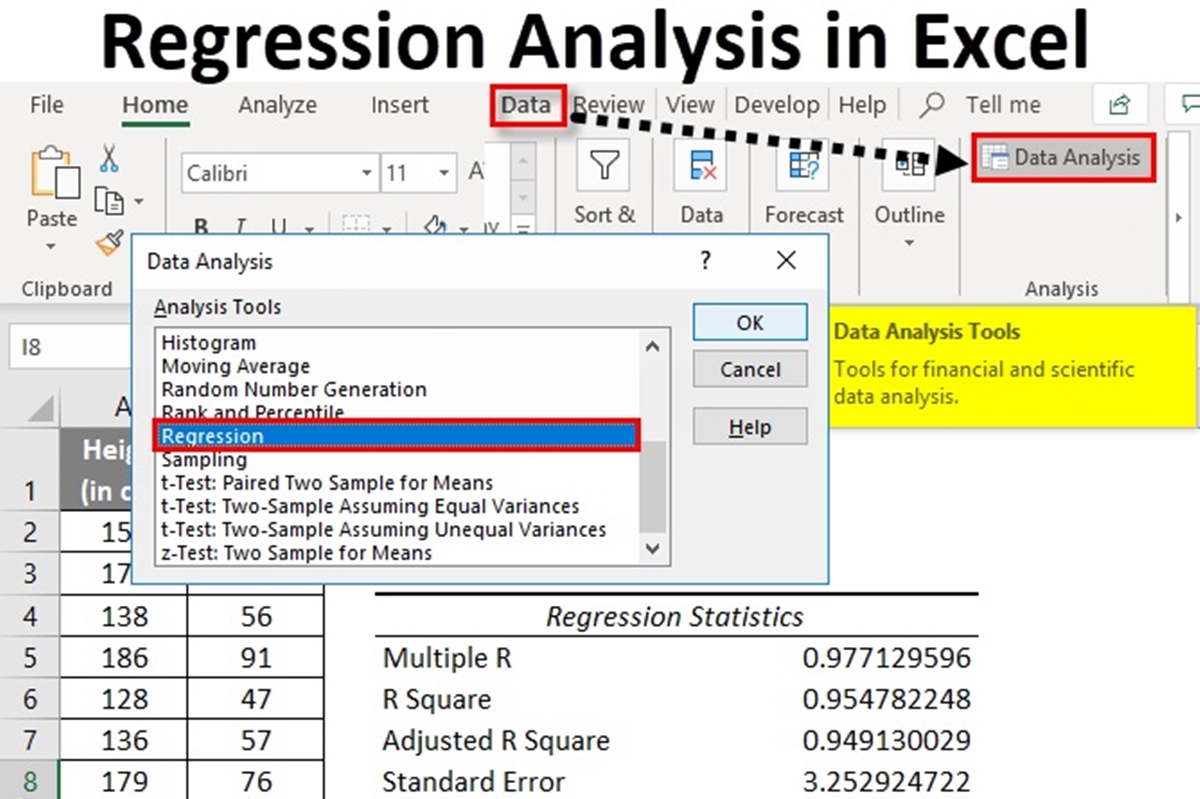
- Select the data range: Highlight the range of data that includes your dependent variable and independent variables. Include the column labels in the selection to ensure accurate interpretation of the results.
- Open the Data Analysis Toolpak: In Excel, go to the “Data” tab and click on “Data Analysis” in the “Analysis” section. If you don’t see the “Data Analysis” option, you may need to enable the Data Analysis Toolpak add-in.
- Choose the regression option: In the Data Analysis dialog box, select “Regression” from the list of analysis tools.
- Specify the input range: In the Regression dialog box, enter the input range for the Y (dependent) and X (independent) variables. Ensure that the “Labels” box is checked if your data includes column headers.
- Choose the output options: Select the output range where you want the regression results to be displayed. You can choose to output the coefficients, residuals, ANOVA table, and other relevant statistics.
- Click “OK” to run the analysis: Once you have set up the input and output ranges, click on the “OK” button. Excel will perform the regression analysis and populate the specified output range with the results.
After running the regression analysis, Excel will display the coefficients, p-values, R-squared value, and other statistics in the designated output range. These results will help you understand the relationship between the variables and evaluate the significance of each independent variable in explaining the variation in the dependent variable.
It is important to note that running a regression analysis is not a one-time process. It requires constant evaluation and refinement. You may need to modify your model, include additional variables, or consider different data transformations to improve the accuracy and reliability of your analysis. Regularly revisiting and updating your regression analysis will ensure that your results remain valid and reflective of the underlying relationships in your data.
Interpreting the Regression Output
After running a regression analysis in Excel, it’s important to interpret the output to gain insights into the relationship between the variables. The regression output provides valuable information about the coefficients, their significance, goodness-of-fit measures, and other statistics. Here are key aspects to consider when interpreting the regression output:
- Coefficients: The regression output displays the coefficients for each independent variable. These coefficients represent the estimated effect of each independent variable on the dependent variable. Positive coefficients indicate a positive relationship, while negative coefficients indicate a negative relationship. The magnitude of the coefficient indicates the size of the effect.
- Significance levels: The p-values associated with each coefficient indicate the statistical significance of the relationship between an independent variable and the dependent variable. A small p-value (typically below 0.05) suggests that the coefficient is statistically different from zero and has a significant impact on the dependent variable. Conversely, a large p-value indicates that the relationship may not be statistically significant.
- R-squared: The R-squared value measures the proportion of the variation in the dependent variable that can be explained by the independent variables. A higher R-squared value indicates a better fit of the model. However, it’s important to note that R-squared alone is not sufficient to assess the validity and reliability of the regression. Other goodness-of-fit measures and diagnostic tests should be considered.
- Residuals: The residuals represent the difference between the observed values of the dependent variable and the predicted values based on the regression model. By analyzing the residuals’ patterns, you can assess the model’s adequacy. Ideally, the residuals should follow a random pattern without any systematic deviations or trends.
- Adjusted R-squared: The adjusted R-squared takes into account the number of independent variables in the model and adjusts the R-squared value accordingly. It penalizes the addition of unnecessary variables to prevent overfitting. The adjusted R-squared is a more conservative measure of the model’s fit, particularly when comparing models with different numbers of independent variables.
When interpreting the regression output, it’s important to consider the context of your study and the underlying assumptions of regression analysis. Assess the plausibility and coherence of the coefficients, check for multicollinearity between independent variables, and evaluate the overall fit of the model. Additionally, consider the limitations of the data and the assumptions made in the regression analysis.
Overall, interpreting the regression output requires careful analysis, understanding of statistical concepts, and consideration of the specific research or practical objectives. It’s essential to interpret the results in a meaningful and relevant manner, taking into account the specific context and purpose of the analysis.
Checking the Assumptions of a Regression Analysis
When conducting a regression analysis in Excel, it is important to check the assumptions of the regression model to ensure the validity and reliability of the results. Violations of these assumptions can lead to biased coefficients, incorrect inferences, and unreliable predictions. Here are the key assumptions to consider:
- Linearity: The relationship between the independent variables and the dependent variable should be linear. This means that the effect of a one-unit change in an independent variable should result in a constant change in the dependent variable. To assess linearity, you can plot the variables and look for patterns or use statistical tests.
- Independence: The observations used in the regression analysis should be independent of each other. This assumes that the observations were randomly sampled and are not influenced by each other. Autocorrelation, or the correlation of residuals over time, can violate this assumption. Various tests, such as the Durbin-Watson test, can be used to check for autocorrelation.
- Homoscedasticity: Homoscedasticity assumes that the spread of the residuals is constant across all levels of the independent variables. This means that the variance of the errors should not change systematically. You can assess homoscedasticity by plotting the residuals against the predicted values or the independent variables.
- Normality: The errors, or residuals, should be normally distributed. This assumption is necessary for hypothesis testing and generating accurate confidence intervals. You can examine the normality of residuals by plotting a histogram or a Q-Q plot and conducting statistical tests, such as the Shapiro-Wilk test.
- No multicollinearity: Multicollinearity occurs when the independent variables are highly correlated with each other. This can make it difficult to determine the individual contribution of each variable. To assess multicollinearity, you can calculate the correlation coefficients between independent variables and check for high values (>0.7).
It is important to note that these assumptions are not always strictly met in real-world data. However, violations of assumptions may impact the interpretation and reliability of your regression results. If assumptions are violated, you may need to consider alternative regression models or apply corrective techniques, such as transformations or variable selection methods.
By checking and validating the assumptions of a regression analysis, you can have more confidence in the results and ensure robust findings. It is recommended to conduct diagnostic tests and perform sensitivity analyses to assess the impact of assumptions and potential violations on the regression results.
Dealing with Multicollinearity
Multicollinearity occurs when there is a high correlation between two or more independent variables in a regression analysis. This can pose challenges in accurately estimating the coefficients and interpreting the relationship between the variables. When multicollinearity is present, it is important to address it to ensure the validity and reliability of the regression results. Here are some strategies for dealing with multicollinearity:
- Identify highly correlated variables: Start by identifying which independent variables are highly correlated with each other. Calculate correlation coefficients or use statistical software to detect these relationships.
- Consider dropping one of the correlated variables: If two or more variables have a high correlation, it may be appropriate to drop one of them from the regression model. Choose the variable that is less theoretically meaningful or conceptually redundant.
- Combine correlated variables: Instead of dropping one of the correlated variables, you can consider creating a new variable by combining them. This can be done through techniques such as creating interaction terms or using principle component analysis (PCA) to create composite variables.
- Standardize variables: Standardizing variables by scaling them to have a mean of zero and a standard deviation of one can help mitigate the impact of multicollinearity. This ensures that all variables are on a similar scale and reduces the correlation among them.
- Use regularization techniques: Regularization techniques, such as ridge regression or lasso regression, can help address multicollinearity by introducing a penalty term to the regression equation. These techniques can shrink the coefficients of correlated variables while still allowing them to remain in the model.
- Collect more data: Sometimes, multicollinearity can be the result of a small sample size. Increasing the sample size can help alleviate multicollinearity by providing more variability in the data.
It is important to note that the chosen approach for dealing with multicollinearity may depend on the specific context of the analysis and the goals of the study. It is crucial to carefully consider the impact and implications of each strategy on the interpretation and reliability of the regression results.
By addressing multicollinearity, you can obtain more accurate and reliable regression estimates. However, it is worth noting that complete elimination of multicollinearity may not always be possible, and some residual correlation between variables may remain. Careful interpretation, consideration of robustness checks, and the use of alternative regression models can help mitigate the impact of remaining multicollinearity.
Interpreting the Coefficients and Significance Levels
When conducting a regression analysis, interpreting the coefficients and significance levels is crucial for understanding the relationship between the independent variables and the dependent variable. These statistics provide insights into the strength, direction, and significance of the impact that each independent variable has on the dependent variable. Here’s how you can interpret the coefficients and significance levels:
- Coefficients: The coefficients represent the estimated effect of each independent variable on the dependent variable, holding other variables constant. A positive coefficient indicates a positive relationship, meaning that as the independent variable increases, the dependent variable tends to increase as well. Conversely, a negative coefficient indicates a negative relationship. The magnitude of the coefficient reflects the size or strength of the relationship.
- Significance levels (p-values): The p-values associated with each coefficient indicate the statistical significance of the estimated relationship. A small p-value (typically below 0.05) suggests that the coefficient is statistically different from zero and has a significant impact on the dependent variable. Conversely, a large p-value indicates that the relationship may not be statistically significant.
- Confidence intervals: Confidence intervals provide a range of values within which the true population coefficient is likely to fall. They indicate the uncertainty associated with the coefficient estimate. The wider the confidence interval, the greater the uncertainty regarding the true value of the coefficient. It is common to use a 95% confidence level.
- Comparing coefficient magnitudes: When interpreting coefficients, it is important to compare their magnitudes. A larger coefficient suggests a stronger impact of the independent variable on the dependent variable. However, interpreting absolute magnitudes may not be sufficient, and it is advisable to consider the context of the study and the measurement scale of the variables.
- Interaction effects: If you have interaction terms in your regression model, the interpretation of coefficients becomes more complex. Interaction effects represent how the relationship between an independent variable and the dependent variable changes depending on the level of another independent variable. To interpret interaction effects, you need to assess the coefficients of the main effects and the interaction terms.
Interpreting coefficients and significance levels requires a careful consideration of the specific context, theoretical expectations, and the nature of the variables being analyzed. It is important to note that regression analysis does not establish causality but rather identifies statistical relationships. Additional robustness checks, diagnostic tests, and theory-driven interpretations should be employed to ensure a comprehensive understanding of the regression results.
Evaluating the Overall Fit of the Regression Model
Assessing the overall fit of a regression model is essential to determine how well it captures the relationship between the dependent variable and the independent variables. Evaluating the model’s fit helps gauge the adequacy of the chosen variables and the reliability of the regression results. Here are key considerations when evaluating the overall fit of a regression model:
- R-squared: R-squared is a measure of how well the model explains the variation in the dependent variable. It represents the proportion of the total variation in the dependent variable that is explained by the independent variables. A higher R-squared value indicates a better fit of the model, as more of the variation is accounted for. However, it is important to interpret R-squared in conjunction with other factors.
- Adjusted R-squared: Adjusted R-squared takes into account the number of independent variables in the model and penalizes models with excessive variables. It is a more conservative measure that adjusts for the sample size and the number of predictors. This helps avoid overfitting the model by not including irrelevant variables.
- F-test: The F-test assesses the overall significance of the regression model. It evaluates whether the regression coefficients, taken together, are statistically significant. A significant F-test suggests that at least one of the independent variables is significantly related to the dependent variable.
- Residual analysis: Analyzing the residuals allows for an assessment of the model’s goodness of fit. Residuals should follow a random pattern, indicating that the model captures the variation in the dependent variable. Plotting residuals against predicted values or independent variables can reveal patterns, outliers, or heteroscedasticity.
- Outliers and influential observations: Identifying outliers and influential observations is crucial in evaluating the model’s fit. Outliers can disproportionately affect the regression estimates, while influential observations can have a substantial impact on the regression model’s slope and fit. Their identification and proper handling may improve the model’s overall fit.
- Cross-validation: Cross-validation techniques, such as train-test splits or k-fold cross-validation, can be employed to assess the model’s predictive performance. This involves splitting the data into training and testing sets and evaluating how well the model generalizes to new or unseen data.
Remember that evaluating the overall fit of a regression model is a complex endeavor that requires careful consideration of multiple factors. No single measure or criterion is sufficient to determine the model’s adequacy. It is crucial to combine different evaluation techniques, incorporate domain expertise, and consider the specific objectives of the analysis.
By critically assessing the overall fit of the regression model, researchers can ensure that it accurately captures the relationships between the variables and provides reliable insights to support decision-making or further investigations.
Making Predictions using the Regression Model
One of the key benefits of regression analysis is its ability to make predictions based on the relationships identified between variables. Once a regression model has been developed and evaluated, it can be used to make predictions for new or future observations. Here’s how you can make predictions using a regression model:
- Specify the values of the independent variables: To make predictions, you need to determine the values of the independent variables for which you want to predict the dependent variable. These values should be consistent with the units and range of the variables used in the regression model.
- Apply the coefficient estimates: Multiply the specified values of the independent variables by their respective coefficient estimates from the regression model. Sum up these products to obtain the predicted value of the dependent variable.
- Consider the uncertainty: Predictions based on regression models typically come with some degree of uncertainty. It is important to consider the standard errors of the coefficients to calculate prediction intervals or confidence intervals around the predicted value. These intervals provide a range within which the true value of the dependent variable is likely to fall.
- Assess potential limitations: Keep in mind the limitations of the regression model, such as the assumptions made, possible extrapolation outside the range of the observed data, or the presence of influential outliers. Predictions should be made within the scope of the model’s validity and its underlying assumptions.
- Validate the model’s predictive performance: Assess the accuracy and reliability of the regression model’s predictions using validation techniques such as cross-validation or comparing predicted values to actual observed values. This step helps evaluate how well the model generalizes to new or unseen data.
It is important to emphasize that predictions from regression models are based on the assumption that the underlying relationships in the data remain stable. Changes in the variables, data characteristics, or contextual factors may impact the accuracy of the predictions.
Nevertheless, regression analysis provides a valuable tool for making informed predictions based on historical data and identified patterns. By carefully interpreting the results and considering the uncertainties, users can leverage regression models to generate valuable insights and support decision-making processes in a wide range of fields.
Assessing the Accuracy and Reliability of the Regression Model
Assessing the accuracy and reliability of a regression model is crucial to ensure the validity and usefulness of the results it produces. Evaluating the model’s performance helps determine its effectiveness in capturing the relationships between the variables and making reliable predictions. Here are key considerations when assessing the accuracy and reliability of a regression model:
- R-squared and adjusted R-squared: R-squared measures the proportion of the variation in the dependent variable that can be explained by the independent variables. A higher R-squared value suggests a better fit. Adjusted R-squared accounts for the number of independent variables and penalizes excessive inclusion of variables, making it a more conservative measure of the model’s performance.
- Cross-validation: Cross-validation techniques, such as train-test splits or k-fold cross-validation, can assess the model’s predictive performance. By splitting the data into training and testing sets, you can gauge how well the model generalizes to new or unseen data. Comparing predicted values against actual observations helps determine the model’s accuracy.
- Residual analysis: Analyzing the residuals can provide insights into the model’s fit. Residuals should follow a random pattern, indicating that the model adequately captures the remaining variation in the dependent variable. Patterns, outliers, or heteroscedasticity in residuals may indicate inadequacies in the model.
- Comparing alternative models: Assessing the accuracy and reliability of a regression model may involve comparing it to alternative models. Consider comparing different functional forms, variable combinations, or alternative regression techniques. Evaluating model fit statistics, such as AIC or BIC, can help in model comparison.
- Sensitivity analysis: Conducting sensitivity analyses can assess the robustness of the regression model’s results. This involves varying model specifications, assumptions, or outlier handling techniques to examine the stability of the coefficients and their significance.
- External validation: If applicable, external validation can provide an additional measure of accuracy and reliability. This involves comparing the model’s predictions with independent data or established benchmarks to evaluate its performance in real-world scenarios.
It is important to note that assessing the accuracy and reliability of a regression model is an ongoing and iterative process. It requires careful evaluation and revision of the model based on the results, feedback, and contextual considerations.
By evaluating the accuracy and reliability of the regression model, researchers can ensure that it provides valid and trustworthy insights. This helps improve decision-making, enhances the understanding of relationships between variables, and supports further analysis or investigations based on the regression model’s findings.
Troubleshooting Common Regression Analysis Issues
Regression analysis, like any statistical technique, can encounter challenges or issues that may affect the accuracy and reliability of the results. It is important to be aware of these common issues and know how to troubleshoot them. Here are some common regression analysis issues and potential solutions to address them:
- High p-values: High p-values indicate that the coefficients of independent variables are not statistically significant. This may be due to insufficient data, multicollinearity, or the inclusion of irrelevant variables. Consider addressing these issues by collecting more data, addressing multicollinearity, or reevaluating variable selection.
- Multicollinearity: Multicollinearity occurs when independent variables are highly correlated. It can lead to unstable coefficient estimates and difficulties in interpreting the relationship between variables. To mitigate multicollinearity, consider dropping one of the highly correlated variables, combining correlated variables, standardizing variables, or using regularization techniques.
- Heteroscedasticity: Heteroscedasticity refers to non-constant variance of residuals across the range of predictor variables. This violation of assumptions may lead to unreliable standard errors and significance tests. To address heteroscedasticity, consider transforming variables, using weighted least squares regression, or including additional variables to explain the heterogeneity of the error variance.
- Outliers and influential observations: Outliers or influential observations can disproportionately affect the regression results. Identify and investigate influential observations using diagnostic techniques such as Cook’s distance or leverage plots. Consider removing outliers or influential observations if they are deemed to be influential due to measurement errors or extreme values.
- Nonlinearity: Linear regression assumes a linear relationship between the independent and dependent variables. If a linear relationship does not hold, consider using polynomial regression, logarithmic transformation, or other nonlinear regression techniques to capture the nonlinearity in the data.
- Missing data: Missing data can introduce bias and affect the accuracy of the regression analysis. Depending on the nature and extent of missing data, strategies such as complete case analysis, imputation techniques, or sensitivity analysis can be employed to handle missing data.
- Violation of independence assumption: The independence assumption assumes that the observations are independent of each other. This might be violated if the data is collected over time or if there is clustering within groups. To address this issue, consider using techniques such as time series analysis or clustered regression models that account for the violation of independence.
It is crucial to carefully diagnose and address these common issues during the regression analysis process to ensure the validity and reliability of the results. Additionally, engaging in continuous learning and seeking expert advice can significantly aid in troubleshooting and resolving regression analysis challenges.
Limitations of Regression Analysis in Excel
While Excel is a widely used and accessible tool for regression analysis, it does have some limitations that should be considered. Understanding these limitations is crucial to ensure appropriate use and interpretation of regression results. Here are some key limitations of regression analysis in Excel:
- Data size limitations: Excel has limitations on the amount of data it can handle effectively. Large datasets may exceed the capacity of Excel, leading to performance issues or inaccurate results. It is important to assess whether the dataset size is appropriate for the available resources and consider alternative software or programming languages for handling larger datasets.
- Limited statistical capabilities: While Excel provides basic regression analysis functionality, it may lack advanced statistical capabilities that are often needed for in-depth analyses. Sophisticated regression techniques such as generalized linear models, survival analysis, or hierarchical regression may require specialized software or programming languages.
- Lack of control over assumptions: Excel’s regression tool does not provide extensive control over the assumptions of regression analysis. Users must be aware that Excel assumes independence, linearity, homoscedasticity, and normality of residuals unless alternative tools or custom code are used to assess and address these assumptions.
- Difficulty in multilevel modeling: Excel is not well-suited for multilevel modeling that involves nested data or hierarchical structures. Analyzing data with multiple levels of dependence, such as individuals nested within groups or repeated measures, requires specialized software that can handle the complexity of such models.
- Limited diagnostic tools: Excel’s built-in regression tool provides limited diagnostic tools compared to specialized statistical software. Additional diagnostic tests and visualizations, such as residual plots, influence analysis, or goodness-of-fit measures, may need to be performed outside of Excel to thoroughly assess model assumptions and validity.
- Lack of advanced modeling techniques: Excel may not support advanced modeling techniques, such as machine learning algorithms, time series analysis, or panel data regression. To apply these techniques, advanced statistical software or programming languages are often required.
- No built-in k-fold cross-validation: Cross-validation is an important technique for assessing the predictive performance of a regression model. Excel does not provide a built-in function for k-fold cross-validation, necessitating manual implementation or the use of specialized software.
Recognizing the limitations of regression analysis in Excel is essential for researchers and analysts to make informed decisions regarding the appropriate tool for their specific analysis needs. Depending on the complexity of the analysis and the availability of resources, seeking more advanced statistical software or programming languages may be necessary to overcome these limitations.